 English
  Русский
 Bahasa Indonesia
 Bahasa Malay
 ไทย
ไทย Español
 Deutsch
 Български
 Français
 Tiếng Việt
 中文
中文 বাংলা
বাংলা हिन्दी
 Čeština
 Українська
 Română

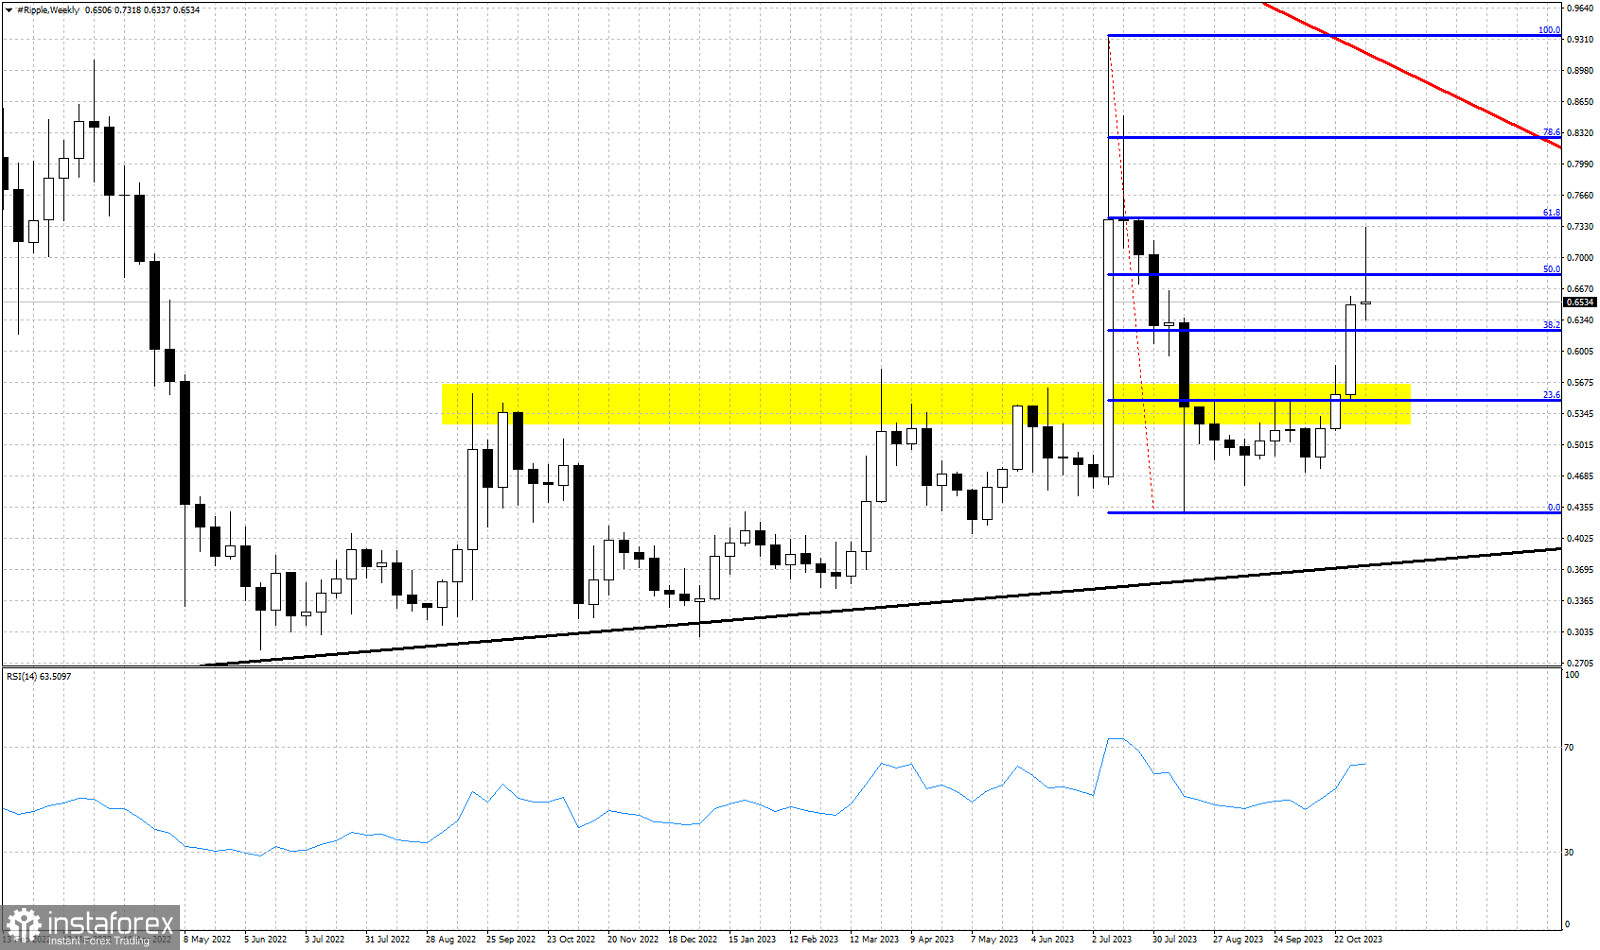
Blue lines- Fibonacci retracement levels
Black line- long-term support
Red line- long-term resistance
Yellow rectangle- horizontal support
XRPUSD is trading around $0.65. Price reached very close to our 61.8% Fibonacci retracement target at $0.74. XRPUSD made a high at $0.7318 a few days ago, however the weekly candlestick has is showing reversal signs. Price is showing rejection signs at the 61.8% Fibonacci retracement level. This is the first warning. The second warning is the candlestick pattern in the weekly chart. The long upper tail with price near its weekly lows is a bearish shooting star pattern. Combined with a rejection at the 61.8% Fibonacci level suggests that we should expect XRPUSD see lower levels next week. Keep in mind that support is key at $0.55 area and below that we have $0.38.