 English
  Русский
 Bahasa Indonesia
 Bahasa Malay
 ไทย
ไทย Español
 Deutsch
 Български
 Français
 Tiếng Việt
 中文
中文 বাংলা
বাংলা हिन्दी
 Čeština
 Українська
 Română

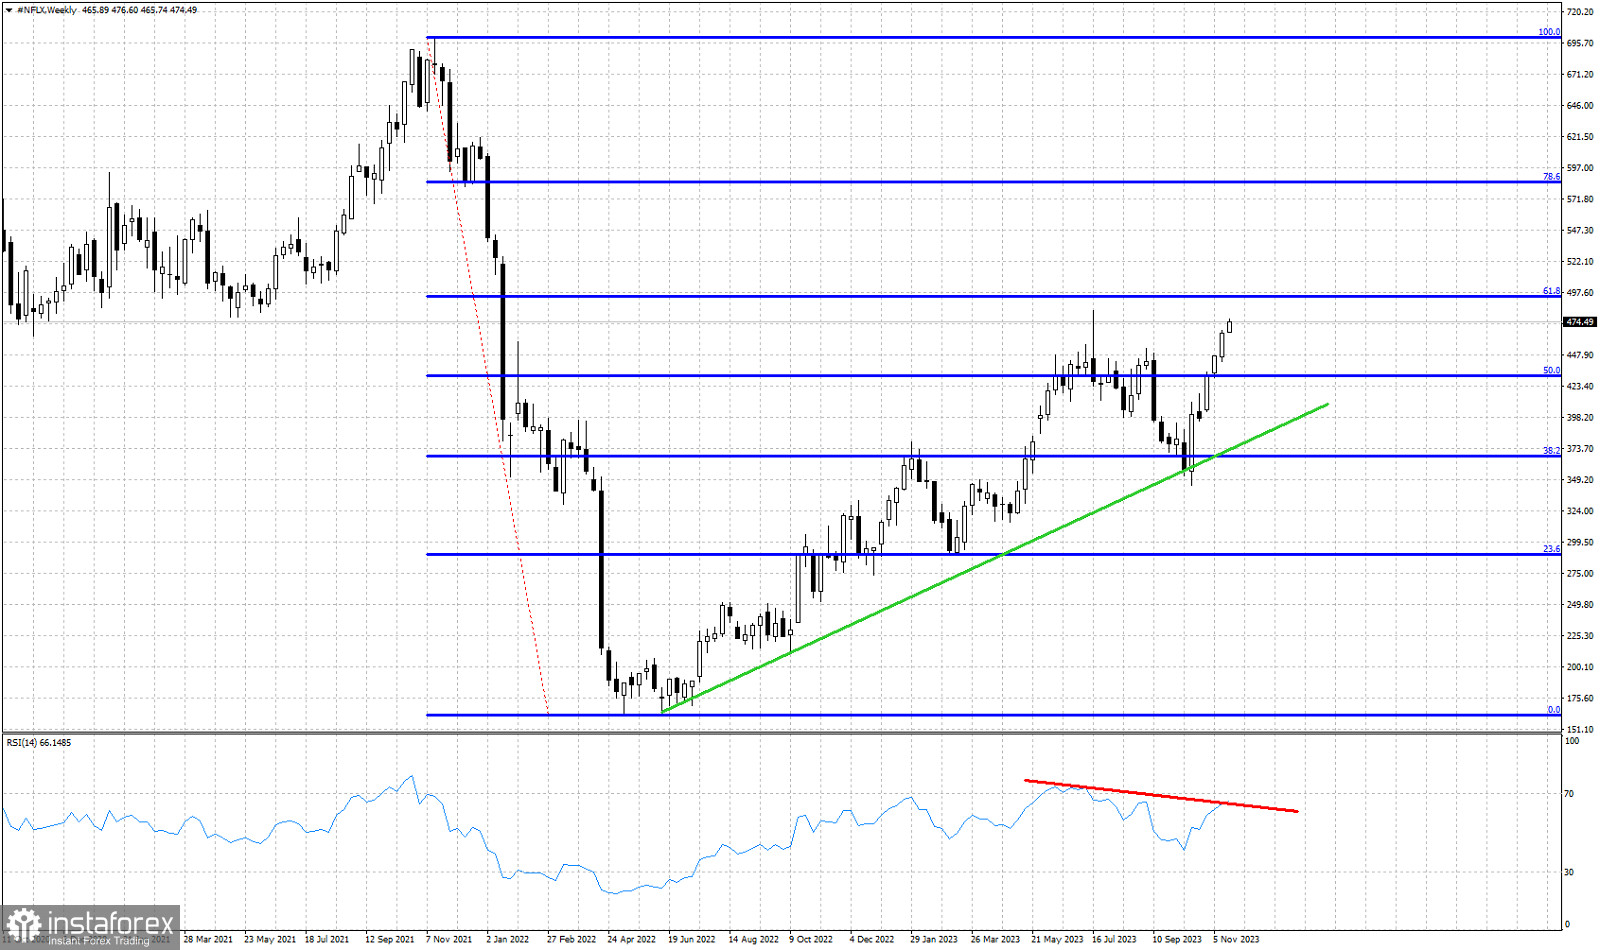
Red lines- bearish RSI divergence
Blue lines- Fibonacci retracement levels
Green line- support trend line
NFLX stock price is trading around $474 making new highs relative to last week and breaking above levels not seen since July. Price is approaching once again the major Fibonacci resistance level at $492. NFLX stock price is currently in an impressive vertical run to the upside erasing the losses of the last few months. Last week's close was above the highest weekly close of 2023. Only on intraday basis has price seen higher levels at $483 back in July. Current momentum suggests that we will break above this level and re-test the 61.8% Fibonacci retracement. The bearish RSI divergence is a warning that should not be ignored. However we have no weekly reversal signal. The Green trend line providing support at $374 remains our key indicator of the medium-term trend. A rejection at the 61.8% retracement will create a double top. This is not something bulls want to see.