 English
  Русский
 Bahasa Indonesia
 Bahasa Malay
 ไทย
ไทย Español
 Deutsch
 Български
 Français
 Tiếng Việt
 中文
中文 বাংলা
বাংলা हिन्दी
 Čeština
 Українська
 Română

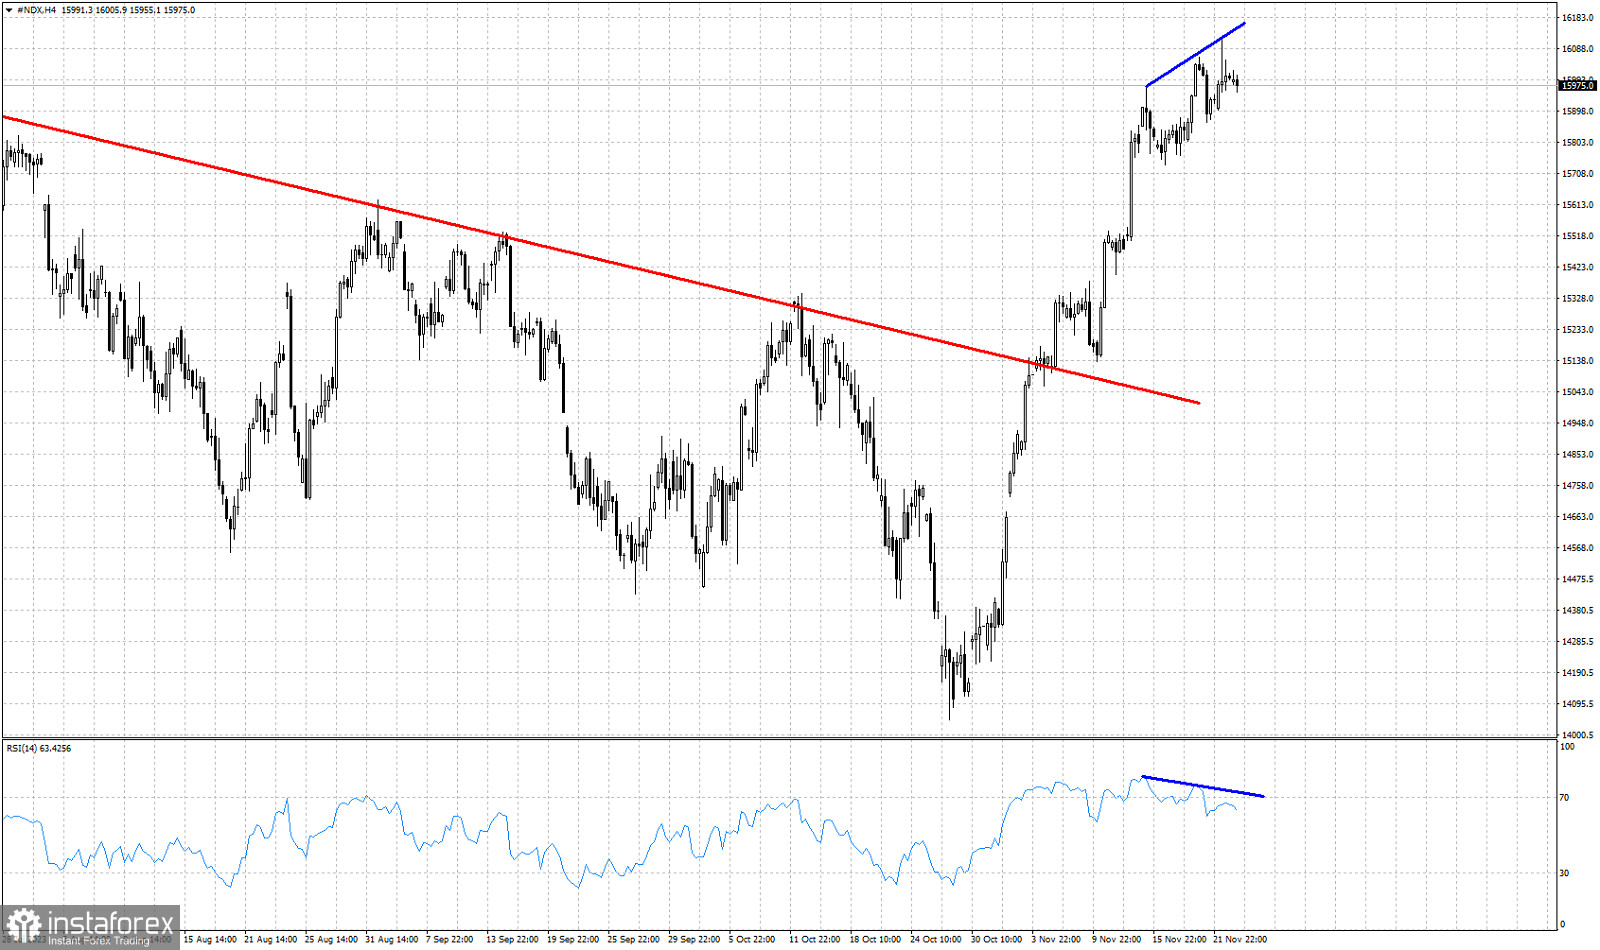
Red line -resistance trend line (broken)
Blue lines- RSI bearish divergence signs.
Nasdaq is trading around 15,970. There are increased chances that the top is in and we are at the early stages of a reversal. Technically trend remains bullish as price continues making higher highs and higher lows. The RSI is making lower highs providing us with bearish divergence signs. The index has made an impressive almost vertical rise during the last 30 days breaking above key resistance trend line. At current levels we believe that it is more probable for price to make at least a pull back to back test the broken trend line. The RSI has provided us with a first warning. A break below 15,860 will be our first sell signal if and when it comes.