 English
  Русский
 Bahasa Indonesia
 Bahasa Malay
 ไทย
ไทย Español
 Deutsch
 Български
 Français
 Tiếng Việt
 中文
中文 বাংলা
বাংলা हिन्दी
 Čeština
 Українська
 Română

Overview :
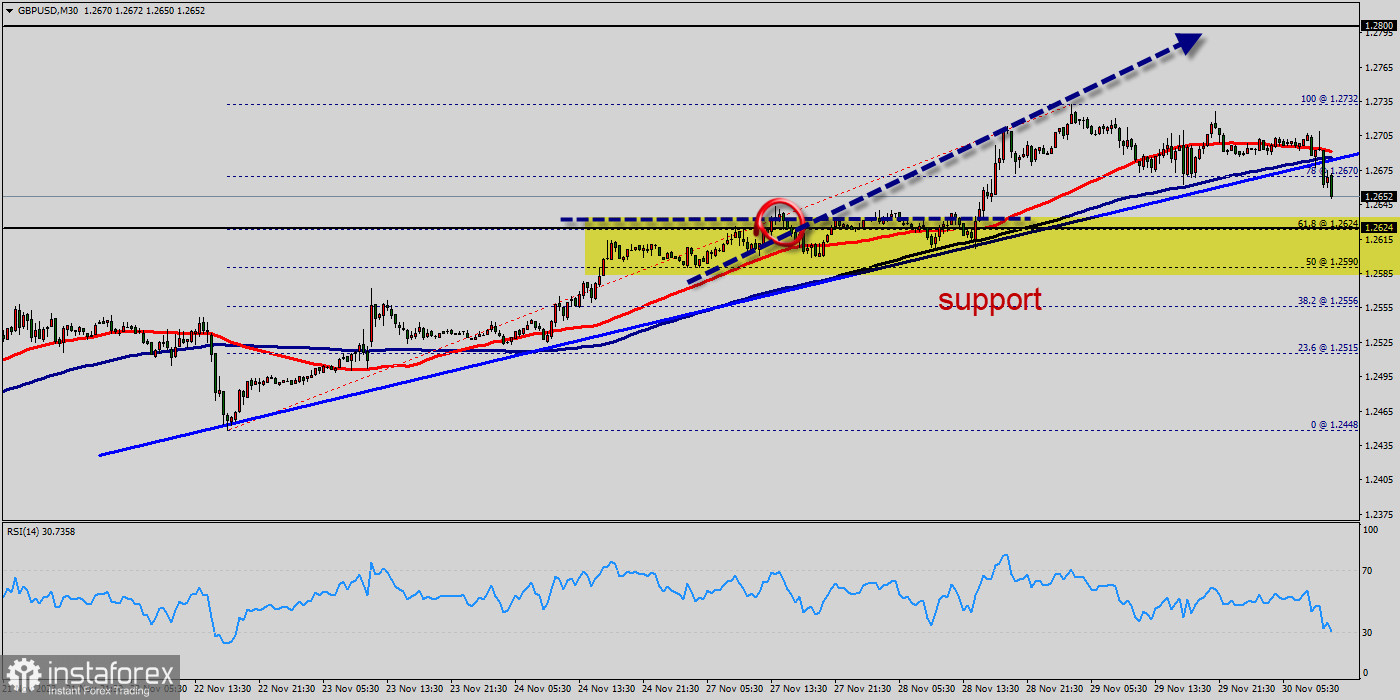
The GBP/USD pair is going to continue to rise from the level of 1.2624 in the long term. It should be noted that the support is established at the level of 1.2624 which represents the 61.8% Fibonacci retracement level on the M30 chart.
The price is likely to form a double bottom in the same time frame. Accordingly, the GBP/USD pair is showing signs of strength following a breakout of the highest level of 1.2624.
The GBP/USD pair faced strong support at the level of 1.2624 because resistance became support. So, the strong support has already faced at the level of 1.2624 and the pair is likely to try to approach it in order to test it again.
The level of 1.2624 represents a weekly pivot point for that it is acting as major support this week. Furthermore, the GBP/USD pair is continuing to trade in a bullish trend from the new support level of 1.2624. It should be noted that the RSI is still above 30.
Currently, the price is in a bullish channel. According to the previous events, we expect the GBP/USD pair to move between 1.2624 and 1.2800.
So, buy above the level of 1.2624 with the first target at 1.2732 in order to test the daily resistance 1 and further to 1.2800. Also, it might be noted that the level of 1.2800 is a good place to take profit because it will form a double top.
On the other hand, in case a reversal takes place and the GBP/USD pair breaks through the support level of 1.2624, a further decline to 1.2556 can occur which would indicate a bearish market.