 English
  Русский
 Bahasa Indonesia
 Bahasa Malay
 ไทย
ไทย Español
 Deutsch
 Български
 Français
 Tiếng Việt
 中文
中文 বাংলা
বাংলা हिन्दी
 Čeština
 Українська
 Română

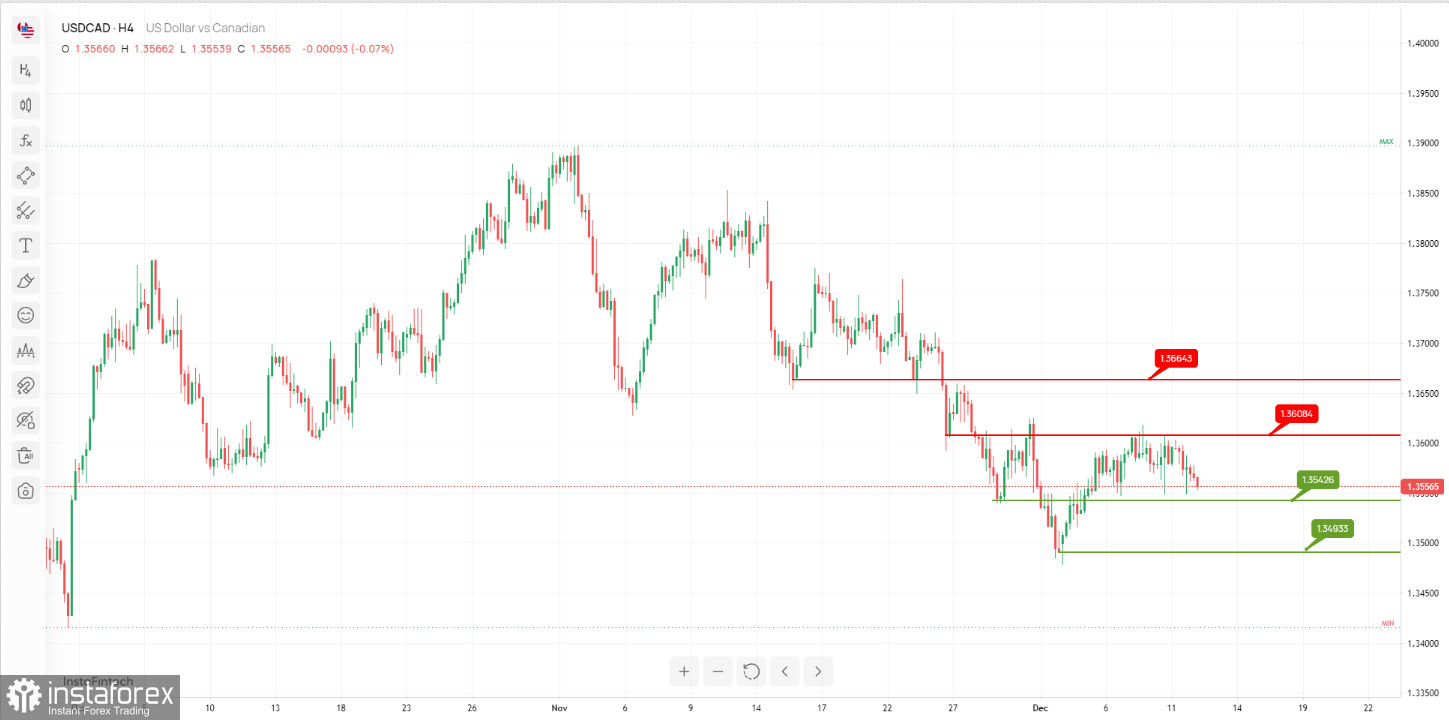
The USD/CAD chart is currently indicating the potential for a bullish bounce, with significant support and resistance levels shaping its price dynamics.
Support Levels:
The 1st support level at 1.35426 is characterized as "Pullback support." This level suggests a potential zone where buying interest may emerge, potentially facilitating a bounce. Furthermore, the 2nd support level at 1.34933 is identified as "Swing low support," reinforcing its role in stabilizing price movements.
Resistance Levels:
On the resistance side, the 1st resistance level at 1.36084 is marked as "An Overlap resistance." This level represents a zone where selling pressure may surface, potentially halting upward momentum. Additionally, the 2nd resistance level at 1.36643 is categorized as "An Overlap resistance," emphasizing its role as a significant resistance zone.