 English
  Русский
 Bahasa Indonesia
 Bahasa Malay
 ไทย
ไทย Español
 Deutsch
 Български
 Français
 Tiếng Việt
 中文
中文 বাংলা
বাংলা हिन्दी
 Čeština
 Українська
 Română

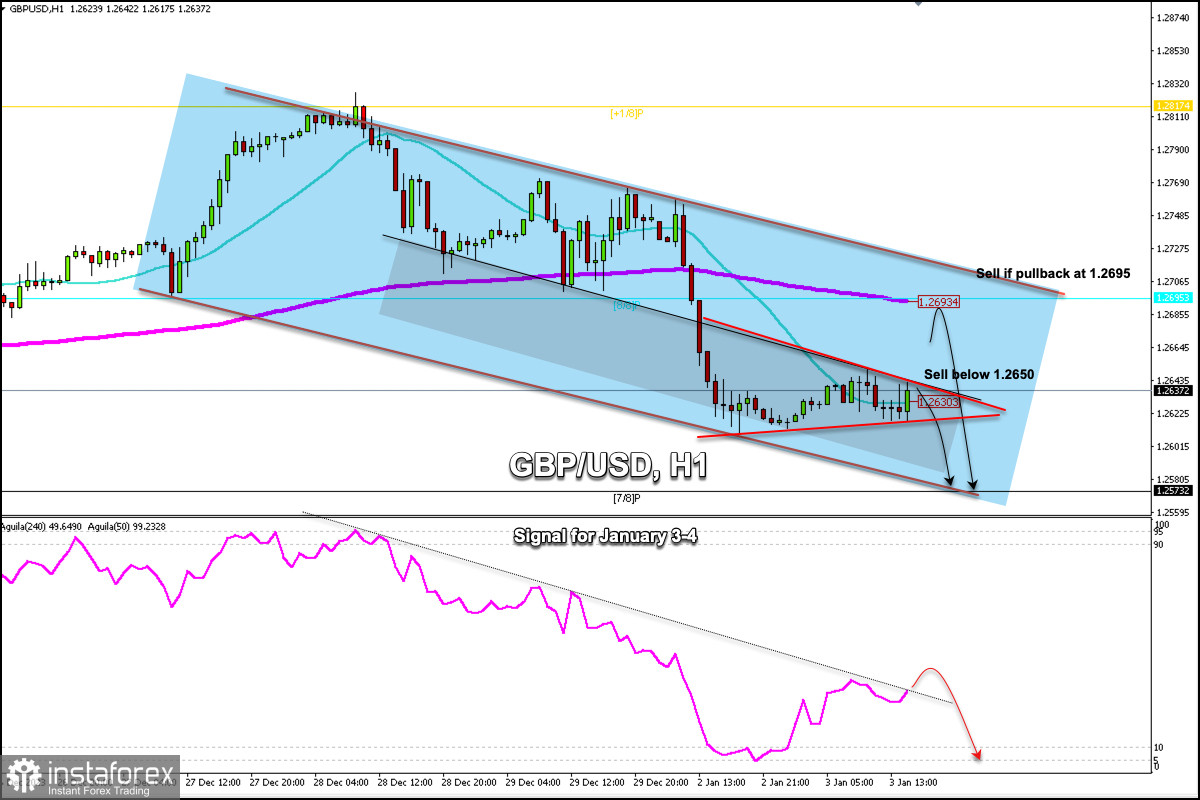
GBP/USD is trading around 1.2637 above the 21 SMA and bouncing after reaching the bottom of the downtrend channel around 1.2610. The British pound is under strong bearish pressure and we can see that it has been testing the top of the secondary downtrend channel around 1.2650. In case the pound falls below this level, we could expect a continuation of the downward movement and it could reach 7/8 Murray at 1.2573.
On the H1 chart we can see the formation of a symmetrical triangle pattern and in case the British pound breaks below this pattern around 1.2620 we could expect a bearish acceleration and this could reach 1.2573 (7/8 Murray).
On the contrary, if the British pound makes a breakout and consolidates above the symmetrical triangle pattern around 1.2650, we could expect a technical bounce and this could reach 8/8 Murray located at 1.2695; a level that also coincides with the 200 EMA located around 1.2693. If this scenario occurs it could be seen as a signal to sell.
An opportunity to buy the British pound could be seen only if it consolidates above the 21 SMA located at 1.2630 which could give the GBP/USD pair a chance to recover but we should be careful because the pair is trading since December 27th within a downtrend channel.
As long as the British pound trades below 1.2750 in the short term any pullback could be seen as an opportunity to sell.