 English
  Русский
 Bahasa Indonesia
 Bahasa Malay
 ไทย
ไทย Español
 Deutsch
 Български
 Français
 Tiếng Việt
 中文
中文 বাংলা
বাংলা हिन्दी
 Čeština
 Українська
 Română

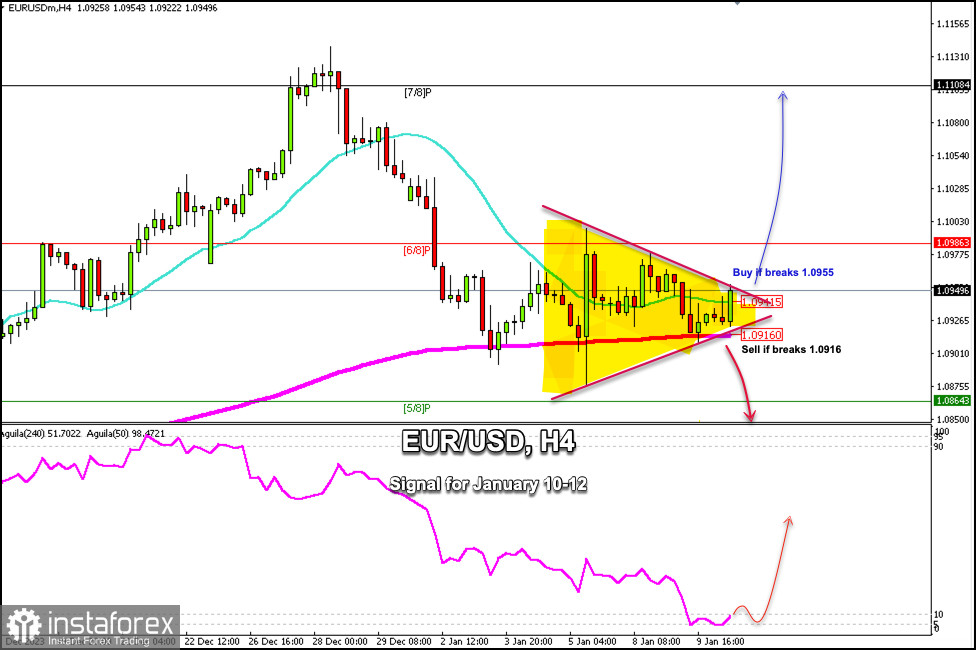
Early in the American session, the euro is trading around 1.0949 within a symmetrical triangle pattern valid since early January. This consolidation is due to some uncertainty in the market ahead of inflation data in the US, which causes the euro to get stuck in increasingly narrow ranges.
According to the H4 chart, we can see that the euro has found good support above the 200 EMA located at 1.0916 which could give EUR/USD a positive outlook for the coming days, only if the euro settles above this area.
Additionally, a sharp break above this symmetrical pattern and a close above 1.0955 on the H4 chart could enable the euro to continue rising. EUR/USD could reach 6/8 Murray at 1.0986 and even the psychological level of 1.10. From there, it could reach the 7/ 8 Murray located at 1.1084.
On the contrary, if the Euro falls below the 200 EMA and breaks the symmetrical triangle pattern below 1.0916, we could expect the main downtrend to resume and EUR/USD could reach 5/8 Murray at 1.0864 and even 4/8 of Murray located at 1.0742.
Given that the euro is facing the possibility of a break in one of the directions of the symmetrical triangle, it should first gain strong momentum to clarify a new trend. Therefore, we could be waiting for this to happen to be able to decide whether to buy or sell. If this scenario does not occur, the euro could trade within a range between 1.0955 and 1.0915.