 English
  Русский
 Bahasa Indonesia
 Bahasa Malay
 ไทย
ไทย Español
 Deutsch
 Български
 Français
 Tiếng Việt
 中文
中文 বাংলা
বাংলা हिन्दी
 Čeština
 Українська
 Română

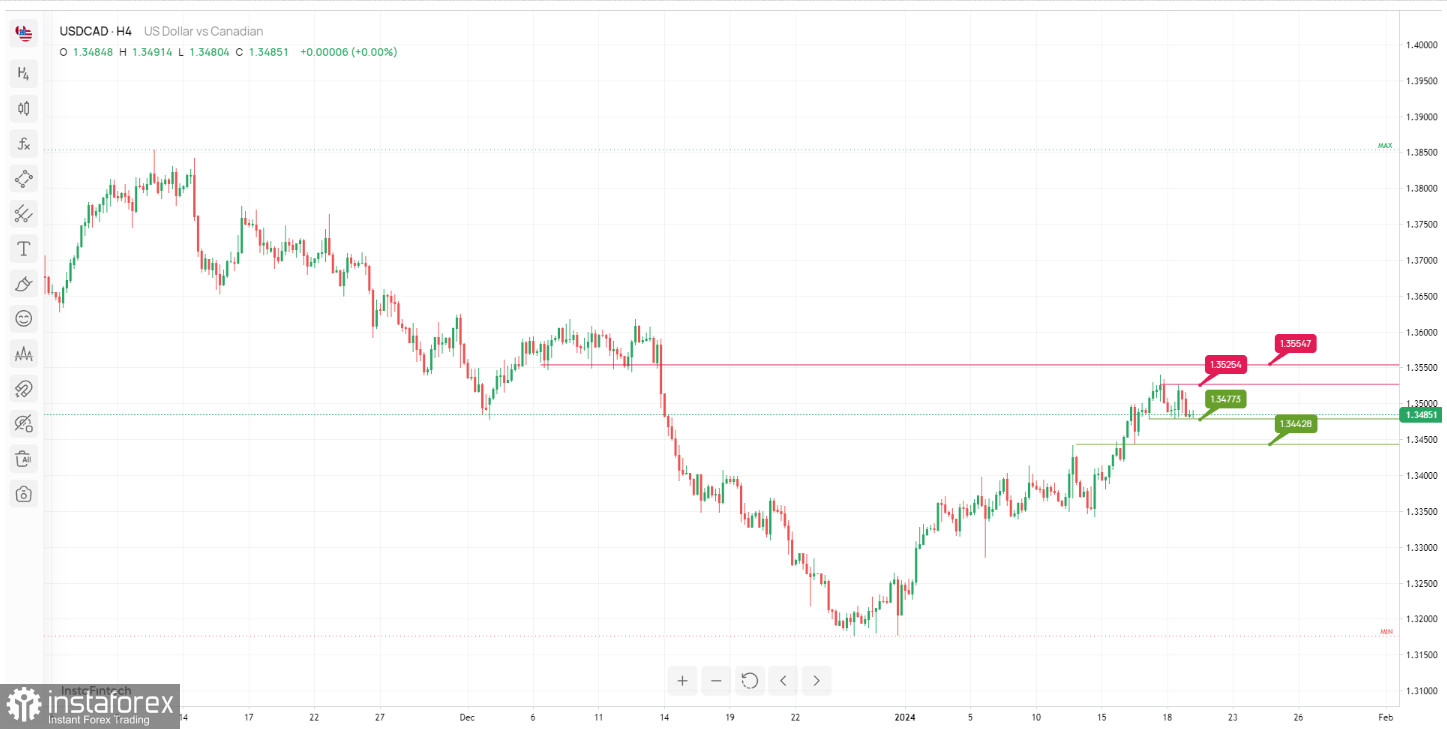
The USD/CAD chart suggests a neutral bias with a focus on price fluctuating between the 1st resistance and the 1st support levels. Here are the key support and resistance levels:
Resistance Levels:
The 1st resistance level at 1.3525 is identified as a "Pullback resistance". This level could act as a barrier to further upward movement.
The 2nd resistance level at 1.3554 also labeled as a "Pullback resistance". It represents another level where selling pressure could emerge and hinder the price from moving higher.
Support Levels:
The 1st support level at1.3477 is a significant support zone, marked as a "Pullback support". This level may attract buying interest and potentially act as a floor for the price.
The 2nd support level at 1.3442 is labeled as an "Overlap support". It serves as an additional support zone where traders might consider entering long positions.