 English
  Русский
 Bahasa Indonesia
 Bahasa Malay
 ไทย
ไทย Español
 Deutsch
 Български
 Français
 Tiếng Việt
 中文
中文 বাংলা
বাংলা हिन्दी
 Čeština
 Українська
 Română

GBP/USD
Brief Analysis:
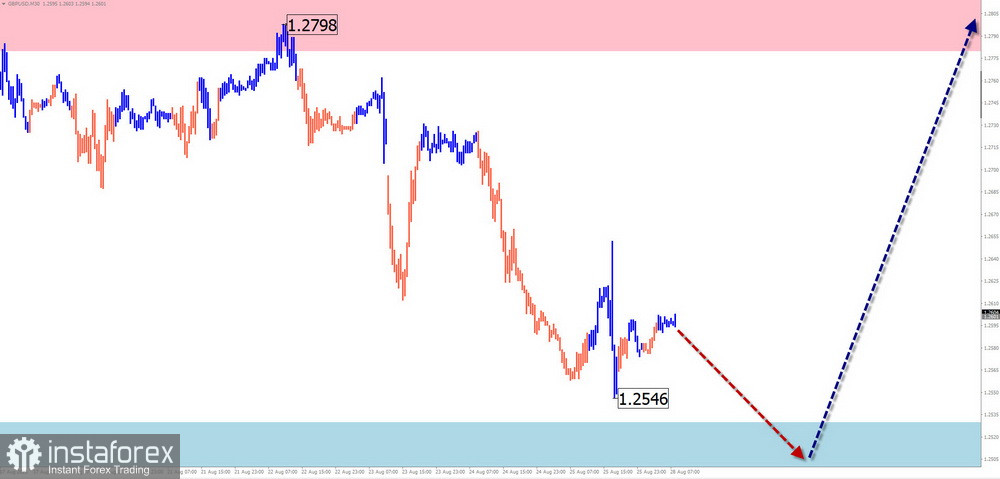
The trend direction of the British pound sterling since September of last year is defined by an upward wave. Over the last month and a half, the price has been forming a correction from the lower boundary of the strong potential reversal zone. The quotes have reached the level of strong daily timeframe support.
Forecast for the week:
At the start of this week, a continuation of the overall flat trend for the British pound with a downward vector is expected. A decline is possible down to support levels. By the end of the week, the likelihood of a reversal and the onset of a price rise had increased up to the resistance levels.
Potential Reversal Zones:
Resistance:
- 1.2780/1.2830
Support:
- 1.2530/1.2480
Recommendations:
Selling: possible in small lots intraday. The support zone limits the potential.
Buying: becomes feasible after confirmed reversal signals appear in the support zone.
AUD/USD
Brief Analysis:
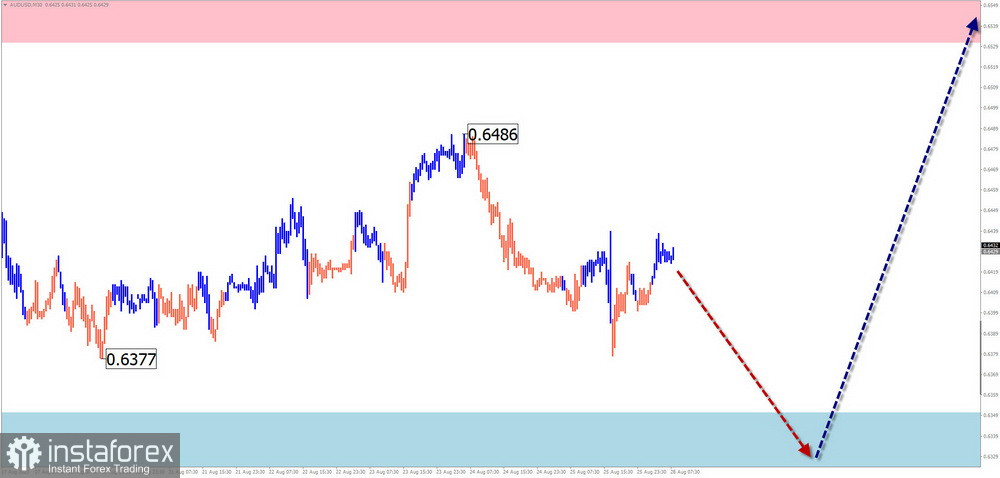
The unfinished segment of the dominant bearish trend in the Australian dollar started on July 14th. The wave structure currently looks complete; however, the chart has no reversal signals. An intermediate resistance level backs the quotes.
Forecast for the week:
A sideways movement is expected in the next couple of days, with a price decrease to the support zone. Closer to the weekend, the likelihood of a change in direction and the start of a price rise increases. Resistance levels indicate the upper boundary of the expected weekly range.
Potential Reversal Zones:
Resistance:
- 0.6530/0.6580
Support:
- 0.6350/0.6300
Recommendations:
Buying: becomes relevant after confirmed reversal signals appear in the resistance zone, as indicated by your trading systems.
Selling: possible with a reduced lot within specific trading systems.
USD/CHF
Brief Analysis:
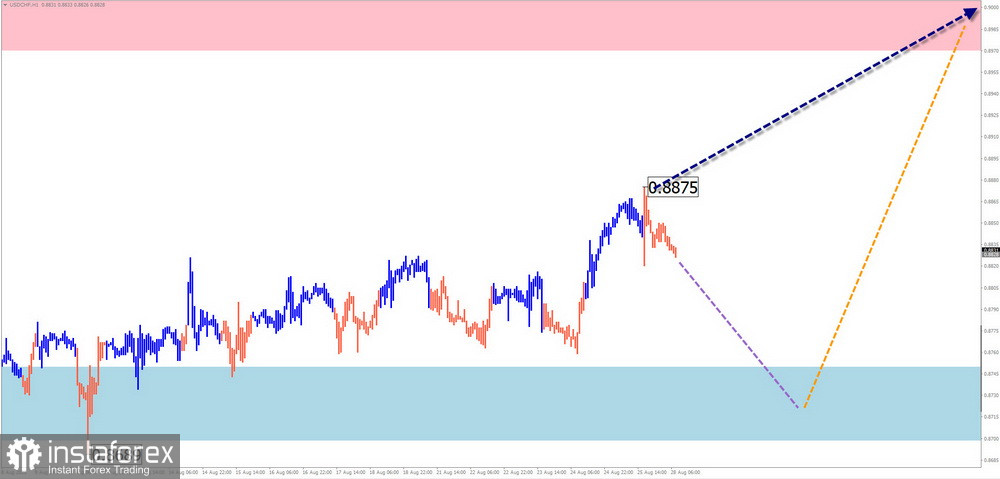
After a multi-month decline since May 14th, the Swiss franc's major price began to form a bullish wave. After breaking through the intermediate resistance, the quotes drifted along its upper boundary, forming a correction.
Forecast for the week:
The upcoming week is expected to see the price movement in a corridor between the nearest opposing zones. In the next couple of days, a downward vector is likely. The second half of the week is expected to be bullish, with the pair's rate rising to the resistance boundaries.
Potential Reversal Zones
Resistance:
- 0.8970/0.9020
Support:
- 0.8750/0.8700
Recommendations
Selling: Possible during individual sessions using "scalping" with a fractional lot.
Buying: Will become relevant after confirmed reversal signals appear at the end of the expected decline.
EUR/JPY
Brief Analysis:
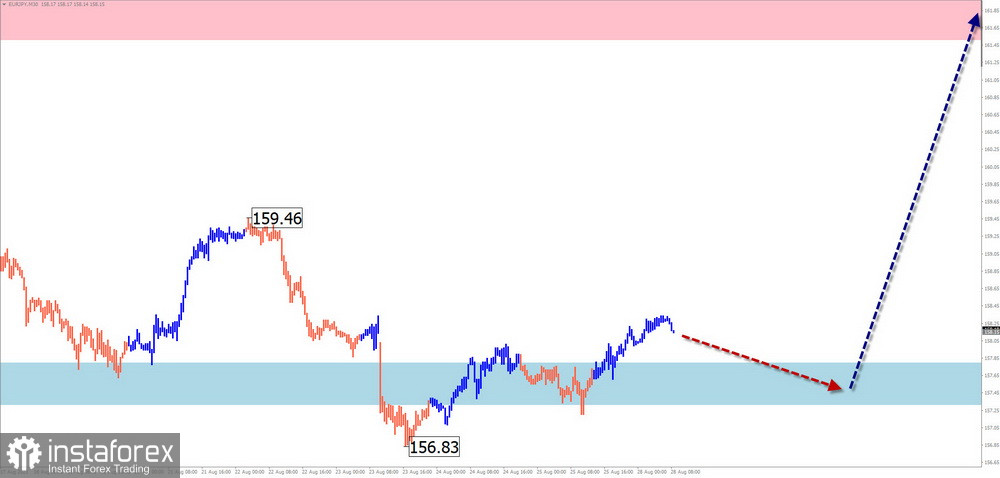
The EUR/JPY pair has consistently moved "north" on the price chart over the years. The current wave, as of today, dates back to June 28th. After breaking the resistance, a correction in this wave structure is developing. Quotes are moving along strong resistance.
Weekly Forecast:
A "sideways" trend along support levels is expected in the coming days. A reversal and the start of a price rise can be anticipated in the latter half. The resistance zone demonstrates the lower limit of the expected weekly movement of the pair.
Potential Reversal Zones
Resistance:
- 161.50/162.00
Support:
- 157.80/157.30
Recommendations
Buying: Has low potential and can be risky. It is recommended to minimize the lot.
Selling: Only relevant once confirmed reversal signals appear in the resistance zone area.
US Dollar Index
Brief Analysis:
The position of the US dollar relative to national currencies continues its march to previously lost positions. The resistance zone, pressed by quotes, has turned into support. The unfinished wave has been counting since July 18th. The middle part (B) of its structure is nearing completion.
Weekly Forecast:
The stagnation period of the US dollar is expected to end in the next couple of days. Afterward, a resumption of price growth can be anticipated. The resistance zone indicates the upper boundary of the probable range of movement.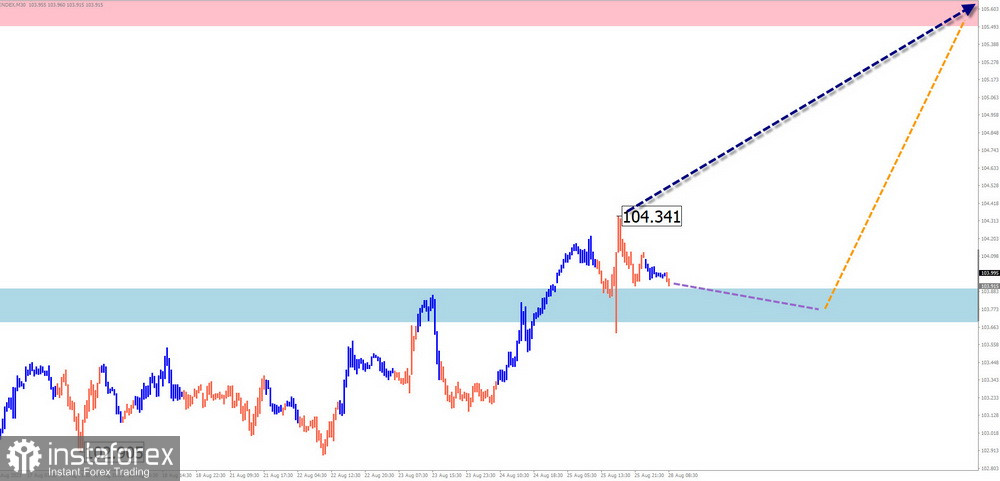
Potential Reversal Zones
Resistance:
- 105.50/105.70
Support:
- 103.90/103.70
Recommendations
Buying: Purchasing national currencies expecting the dollar's weakening may result in deposit losses and is not recommended.
Selling: Transactions betting on weakening currencies in major pairs will continue. Follow the signals of the trading systems in use.
#Ethereum
Brief Analysis:
Ethereum's current unfinished wave structure is directed downwards on the price chart and has been counting since April 14th. The final part is nearing its conclusion. The estimated support passes through the upper boundary of the preliminary target zone.
Weekly Forecast:
A sideways trend for the coin is expected in the coming days, with an upward vector. From the resistance zone, a downward trend can be anticipated right up to the complete end of the decline in the region of the estimated support. A breakthrough below the calculated support is unlikely.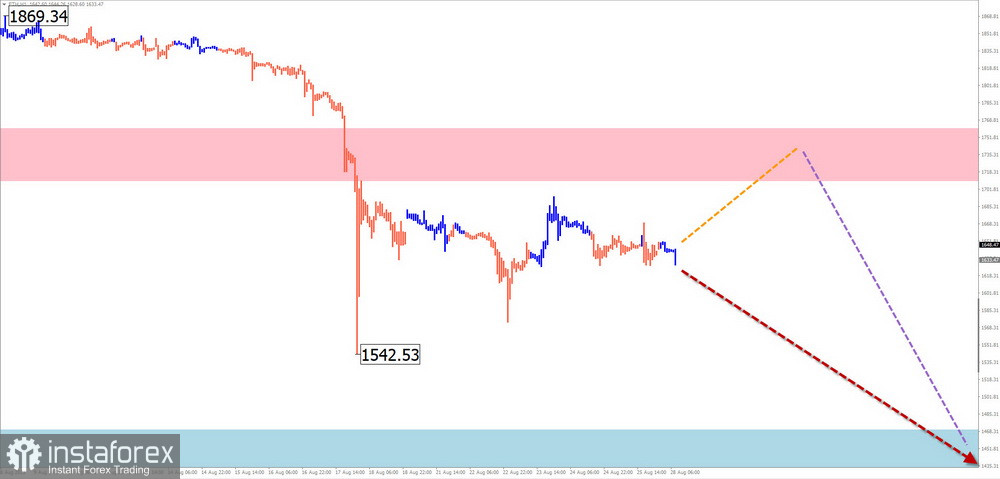
Potential Reversal Zones
Resistance:
- 1710.0/1760.0
Support:
- 1470.0/1420.0
Recommendations
Buying: Has low potential and a high degree of risk. Such transactions can result in losses.
Selling: Will become possible after reversal signals appear in the support zone area, confirmed by your TS.
Explanations: In simplified wave analysis (SWA), all waves consist of 3 parts (A-B-C). On each TF, only the last unfinished wave is analyzed. Dotted lines show expected movements.
Attention: The wave algorithm does not consider the duration of instrument movements over time!