 English
  Русский
 Bahasa Indonesia
 Bahasa Malay
 ไทย
ไทย Español
 Deutsch
 Български
 Français
 Tiếng Việt
 中文
中文 বাংলা
বাংলা हिन्दी
 Čeština
 Українська
 Română

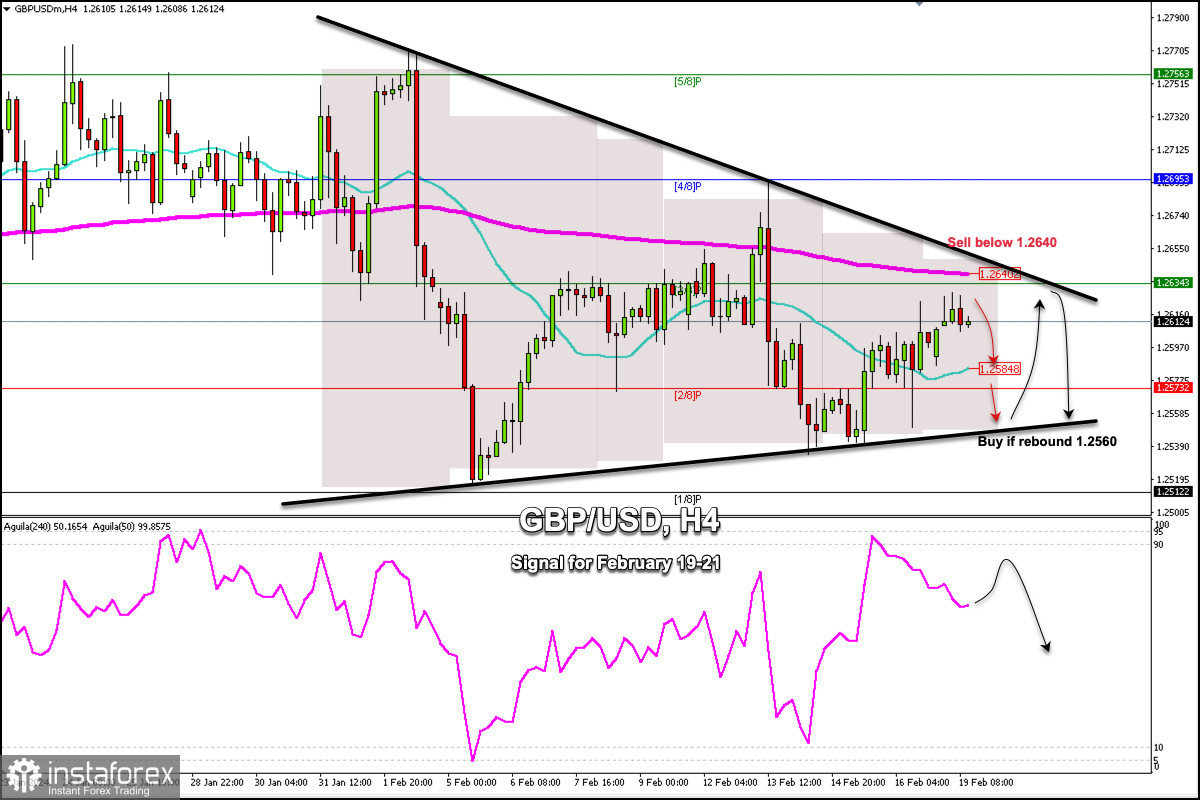
GBP/USD is trading around 1.2612, below the 200 EMA at 1.2640, and within a symmetrical triangle pattern forming since early February. After the British pound has bounced around the psychological level of 1.25, it is now consolidating between 1.25 and 1.27.
In case the British pound reaches the 21 SMA located at 1.2584, we could expect a technical bounce to occur and the instrument could reach the 200 EMA located at 1.2640.
On the other hand, in case bullish strength prevails, a technical bounce is expected to occur around 1.2560 which could be seen as a buying opportunity with targets at 1.2630.
When a symmetrical triangle formation occurs, GBP/USD will get stuck within this pattern. Moves inside a trading range shorten each time until a sharp break occurs.
Meanwhile, there is an opportunity to buy and sell only if the pair bounces and makes a correction at the support and resistance levels.
The market sentiment report shows that there are 53.09% of traders who are buying the British pound. This statistic has always been interpreted by us as a signal to sell. So, as long as the British pound trades below the 200 EMA, it will be seen as a signal to sell in the coming days.