 English
  Русский
 Bahasa Indonesia
 Bahasa Malay
 ไทย
ไทย Español
 Deutsch
 Български
 Français
 Tiếng Việt
 中文
中文 বাংলা
বাংলা हिन्दी
 Čeština
 Українська
 Română

Key Takeaways:
- The SEC's upcoming discussions with Ethereum ETF applicants may signal a pivotal moment for Ether-based investment products, despite existing regulatory uncertainties.
- Technical analysis of ETH indicates potential bullish and bearish scenarios influenced by both fundamental market developments and recent price trends.
- Traders should monitor the SEC's decisions and Ethereum's technological advancements closely, as these factors will significantly impact ETH's market dynamics.

The Path to Ethereum ETFs: An Analytical Insight
The financial industry is closely monitoring the developments surrounding Ethereum ETFs, especially after the success of Bitcoin ETFs. The U.S. Securities and Exchange Commission (SEC) is poised to discuss these potential Ether-based investment vehicles, marking a significant step in cryptocurrency's integration into mainstream investment portfolios. However, the journey is fraught with regulatory hurdles and technological nuances that differentiate Ethereum from its counterpart, Bitcoin.
The anticipation of Ethereum ETFs stems from the recent approval of Bitcoin ETFs, a milestone that took over a decade to achieve. Despite the excitement, Ethereum faces unique challenges, particularly concerning its classification and technological framework. Unlike Bitcoin's clear commodity status, Ethereum's designation remains in limbo, further complicated by its transition to a proof-of-stake model. This transition, while innovative, raises questions about Ethereum's alignment with traditional financial regulations, potentially influencing the SEC's decision-making process.
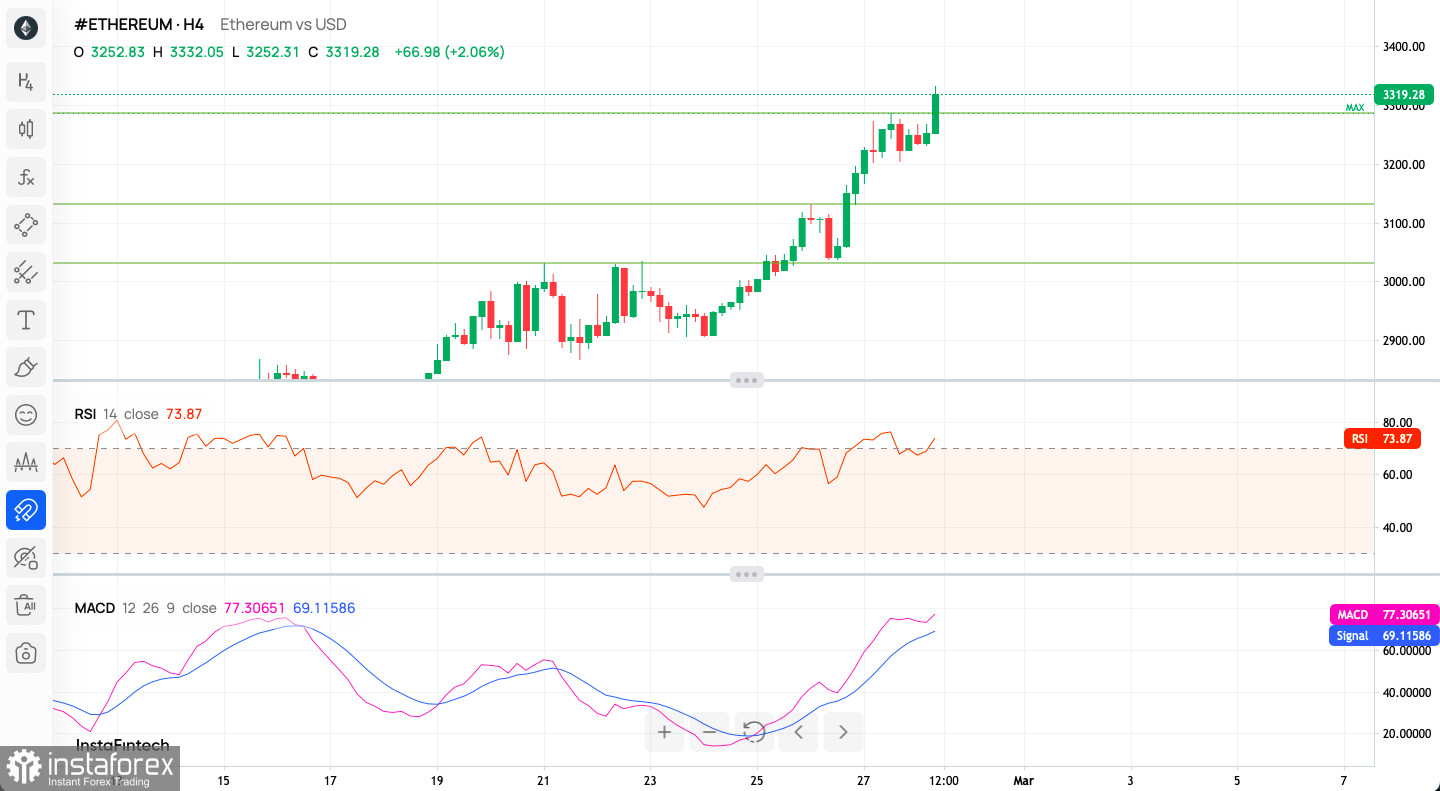
Technical Analysis Outlook:
The ETH/USD pair has been exhibiting a strong uptrend as indicated by the consistent formation of higher highs and higher lows. The price action is well above the major moving averages, signaling bullish momentum. The recent candles are green and sizeable, further supporting the uptrend.
Candlestick Patterns:
The chart shows a bullish continuation pattern with no immediate signs of reversal. The absence of bearish candlestick formations, such as doji or hanging man patterns, suggests that the current trend may persist in the near term.
Moving Averages:
All 18 moving averages are indicating a "Buy" signal, which underscores the robustness of the current bullish trend. The moving averages are likely fanning out in sequence, which is a technical confirmation of a solid uptrend.
Indicators:
- The Relative Strength Index (RSI) is at 73.87, which is near the overbought threshold of 80. While this indicates strong buying pressure, traders should also be cautious of potential pullbacks or consolidations, as the market may be considered overextended.
- The Moving Average Convergence Divergence (MACD) shows both the MACD line and the signal line moving upwards with a significant gap between them, which is a bullish sign. The histogram also reflects growing bullish momentum.
Sentiment Scoreboard:
The sentiment is overwhelmingly bullish, with a score of 77% bulls versus 23% bears. This has increased from the previous week, aligning with the uptrend observed in the price chart. The strong bullish sentiment suggests that market participants may continue to favor long positions.
Weekly Pivot Points:
Pivot points are often used to identify potential support and resistance levels. The current price is well above the weekly pivot point of $2,896, which could now serve as a strong support level in case of a retracement. The WR1 at $2,937 has been surpassed, indicating a potential move towards the next resistance levels at WR2 ($2,929) and WR3 ($3,041).
Technical Analysis Summary:
- Trend: Strong uptrend with bullish price action
- Candlestick Patterns: Bullish continuation, no reversal patterns detected
- Moving Averages: Strong "Buy" signals across all moving averages
- Indicators: RSI nearing overbought territory, MACD showing strong bullish momentum
- Sentiment: Highly bullish market sentiment
- Pivot Points: Price above weekly pivot, indicating strength; potential for further gains towards resistance levels
Given the strong bullish signals across the board, traders may look for opportunities to join the trend on pullbacks towards support levels, while being mindful of the overbought conditions that could lead to temporary retracements. As with any technical analysis, it's important for traders to set appropriate risk management strategies to protect against unforeseen market movements.
Useful Links
Important Notice
The begginers in forex trading need to be very careful when making decisions about entering the market. Before the release of important reports, it is best to stay out of the market to avoid being caught in sharp market fluctuations due to increased volatility. If you decide to trade during the news release, then always place stop orders to minimize losses.
Without placing stop orders, you can very quickly lose your entire deposit, especially if you do not use money management and trade large volumes. For successful trading, you need to have a clear trading plan and stay focues and disciplined. Spontaneous trading decision based on the current market situation is an inherently losing strategy for a scalper or daytrader.