 English
  Русский
 Bahasa Indonesia
 Bahasa Malay
 ไทย
ไทย Español
 Deutsch
 Български
 Français
 Tiếng Việt
 中文
中文 বাংলা
বাংলা हिन्दी
 Čeština
 Українська
 Română

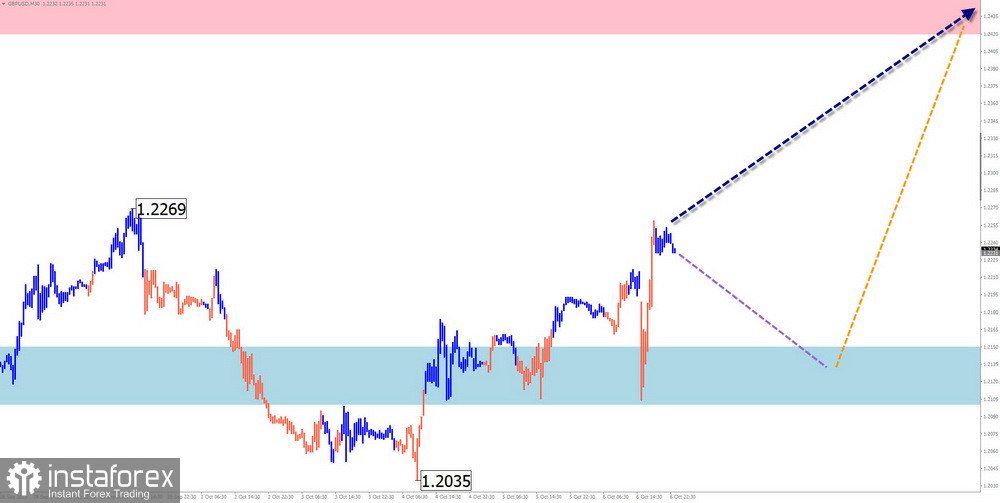
GBP/USD
Brief Analysis:
In mid-July, a trend change occurred on the chart of the major British pound sterling. A bearish wave in reverse replaced the uptrend. After contacting the upper boundary of a strong support zone, an ascending corrective wave zigzag formation began. After its complete completion, the price decline will continue.
Week Forecast:
In the upcoming week, the British pound's price movement is expected to continue within a sideways corridor between the nearest areas of counter-direction. After possible pressure on the support zone at the beginning of the week, a bullish vector is most likely. The end of the rise can be expected in the calculated resistance area.
Potential Reversal Zones
Resistance:
- 1.2420/1.2470
Support:
- 1.2150/1.2100
Recommendations:
Purchases: Possible with a reduced lot during separate trading sessions. The potential is limited by the resistance zone.
Sales: Not recommended until the current rise is completed and corresponding signals from your trading systems appear in the resistance area.
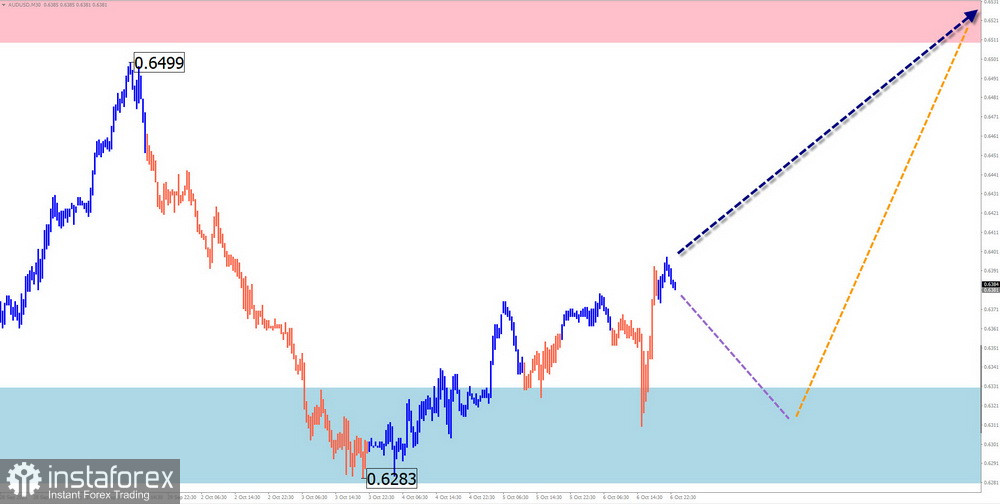
AUD/USD
Brief Analysis:
The major pair of the Australian dollar continues its downtrend. In the last two months, a flat correction has been forming. Its structure is close to completion. The price is at the upper boundary of the potential reversal zone for the weekly timeframe. An ascending section has been developing since October 3rd.
Week Forecast:
In the upcoming weekly period, the chart's quotes are expected to move within the previously formed price corridor. After a probable attempt to pressure the support zone at the beginning of the week, a reversal with a change in the direction vector can be expected. The resistance zone demonstrates the most likely upper boundary of the weekly movement of the pair.
Potential Reversal Zones
Resistance:
- 0.6510/0.6560
Support:
- 0.6330/0.6280
Recommendations:
Sales: Will become relevant after appearing in the resistance zone.
Purchases: Will become possible after the appearance of reversal signals confirmed by your trading systems in the support zone.
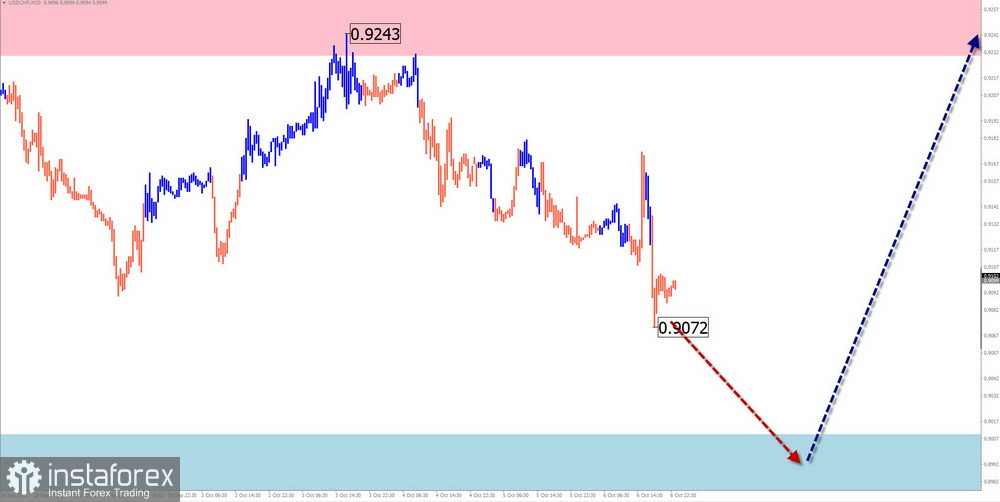
USD/CHF
Brief Analysis:
An upward wave has set the direction of the price trend for the Swiss franc since mid-July. The price has reached the lower boundary of the potential reversal zone for the daily timeframe. The wave structure does not look formed at the time of analysis. Quotes from this level have been pulling back down over the past two weeks, forming an intermediate correction.
Week Forecast:
At the beginning of the upcoming week, a decrease in the exchange rate of the pair is expected, down to the calculated support boundaries. Closer to the weekend, the formation of a reversal and a resumption of the price rise can be expected. The support level demonstrates the lower boundary of the expected weekly movement of the pair.
Potential Reversal Zones
Resistance:
- 0.9230/0.9280
Support:
- 0.9010/0.8960
Recommendations
Sales: Possible with a reduced lot during separate trading sessions. The potential is limited by support.
Purchases: Will become relevant after the appearance of confirmed reversal signals in the support zone.
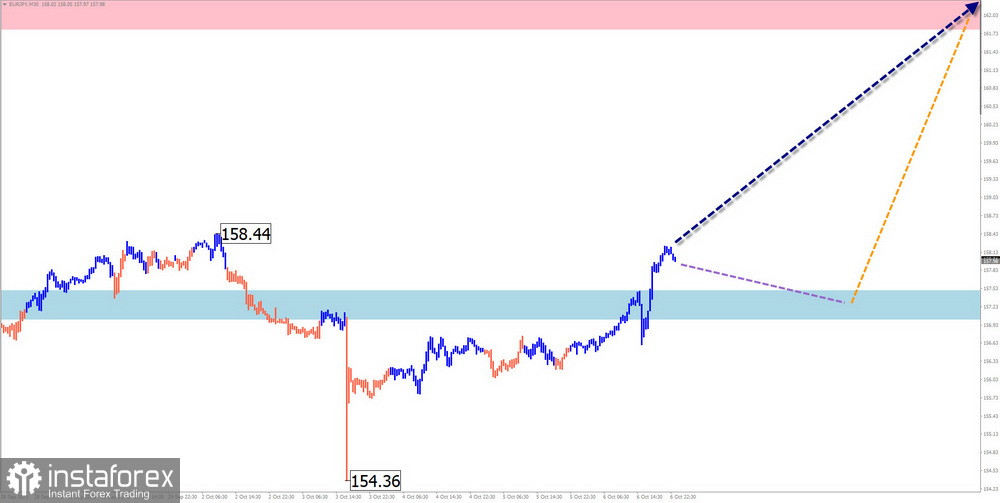
EUR/JPY
Brief Analysis:
The trend direction of the Euro/Japanese Yen on the chart has been set by an ascending wave algorithm for over three years. The current short-term wave started at the end of July. The analysis of the structure shows the completion of the first two parts (A–B). The pair's quotes mainly move along with the strong support of the senior timeframe.
Week Forecast:
In the first days of the upcoming weekly period, the most likely scenario will be a sideways movement along the support zone. The resumption of price growth can be expected in the second half of the week. Increased volatility and a change in direction may coincide with the release of important economic data.
Potential Reversal Zones
Resistance:
- 161.80/162.30
Support:
- 157.50/157.00
Recommendations
Sales: Have no potential. Can lead to a loss of the deposit.
Purchases: Will be recommended after the appearance of reversal signals in the support zone.
$ (USDollar) Index
Brief Analysis:
The trend direction of the U.S. Dollar Index has been pointing "north" in the price field since the beginning of last year. The unfinished trend section counts as of July 14th. Last week, quotes reached the lower boundary of the potential reversal zone for the weekly timeframe. Subsequent declines form a correction of the last trend section of the wave.
Week Forecast:
In the coming days, the index's quotes will move sideways with a downward vector. A breakthrough below the calculated support boundary is unlikely. A change in course and a resumption of the upward direction are likely closer to the weekend. The resistance zone demonstrates the upper boundary of the expected weekly movement.
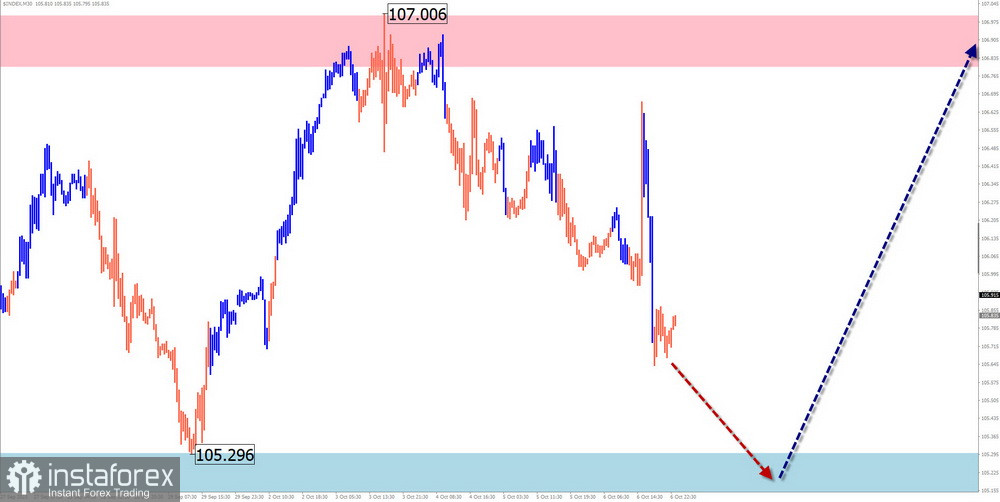
Potential Reversal Zones
Resistance:
- 106.80/107.00
Support:
- 105.30/105.10
Recommendations
Sales: The strengthening of national currencies in major pairs will allow betting on their rise in the coming days.
Purchases: The resumption of the U.S. dollar's strengthening with the sale of national currencies will be recommended after the formation of corresponding reversal signals in the support zone.
Note: In simplified wave analysis (SWA), all waves consist of three parts (A, B, and C). The analysis focuses on the last, unfinished wave in each timeframe. Dotted lines indicate expected movements.
Attention: The wave algorithm does not take into account the duration of instrument movements over time!