 English
  Русский
 Bahasa Indonesia
 Bahasa Malay
 ไทย
ไทย Español
 Deutsch
 Български
 Français
 Tiếng Việt
 中文
中文 বাংলা
বাংলা हिन्दी
 Čeština
 Українська
 Română

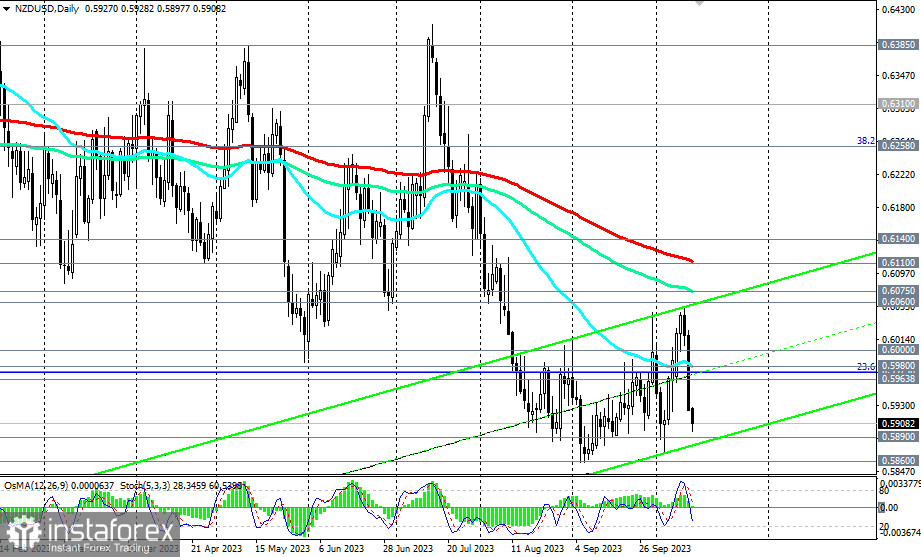
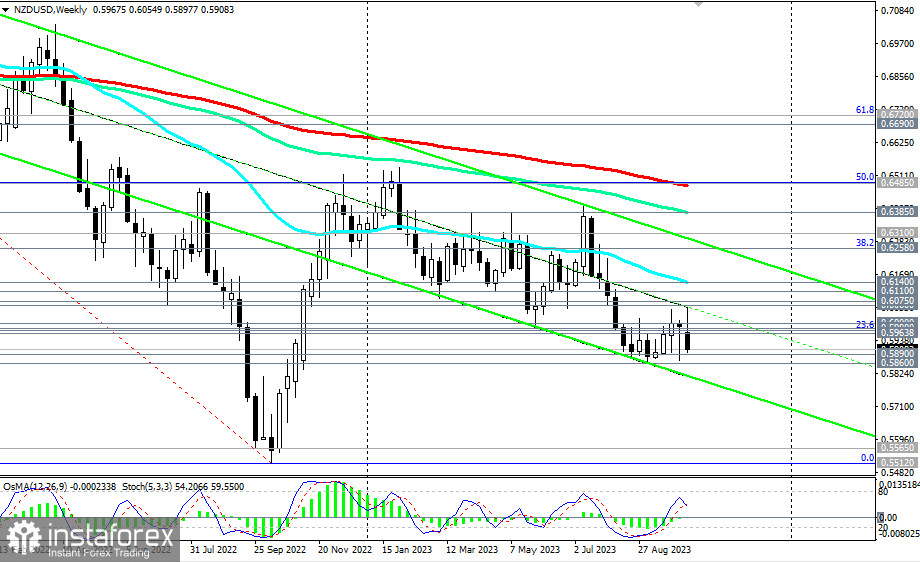
NZD/USD is trading in a bearish market zone: medium-term—below resistance levels at 0.6140 (50 EMA on the weekly chart), 0.6110 (200 EMA on the daily chart), long-term—below resistance levels at 0.6400, 0.6485 (200 EMA on the weekly chart and 50% Fibonacci level in the downward wave from 0.7465 in February 2021 to the level of 0.5510 reached in October 2022). In the primary scenario, we expect a resumption of the decline.
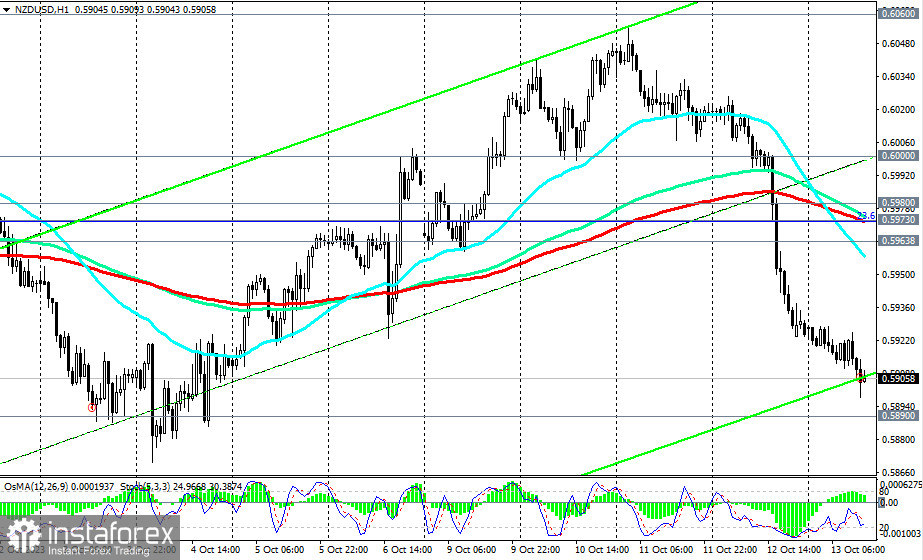
A break below local support levels at 0.5890 and 0.5860 may trigger further declines.
The downside targets are the lows from March 2020 near the levels of 0.5600 and 0.5520.
In an alternative scenario, the first signal for a resumption of long positions could be a breakout of today's high at 0.5928, with confirmation being a breakout of the important resistance level at 0.5973 (200 EMA on the 1-hour chart and 23.6% Fibonacci level), with the prospect of rising to the local resistance level and the upper boundary of the upward channel on the daily chart at 0.6060.
However, only a break of the key resistance level at 0.6140 will take the pair into the medium-term bullish market zone.
Short positions remain preferable.
Support Levels:0.5900, 0.5890, 0.5860, 0.5800, 0.5700, 0.5600, 0.5565, 0.5510
Resistance levels: 0.5928, 0.5964, 0.5973, 0.5980, 0.6000, 0.6060, 0.6075, 0.6100, 0.6110, 0.6140, 0.6200, 0.6258, 0.6310, 0.6385, 0.64 00, 0.6485, 0.6500, 0.6510