 English
  Русский
 Bahasa Indonesia
 Bahasa Malay
 ไทย
ไทย Español
 Deutsch
 Български
 Français
 Tiếng Việt
 中文
中文 বাংলা
বাংলা हिन्दी
 Čeština
 Українська
 Română

GBP/USD
Brief analysis:
Since mid-July, the quotes of the main pair of the British pound have been forming a descending wave. On a larger timeframe, this segment constitutes a correction. The price has reached the upper boundary of a strong support zone on the daily timeframe. Over the last month and a half, quotes have been forming a correction, and its structure appears completed. The descending segment from November 14 has a reversal potential.
Weekly forecast:
In the next couple of days, the price of the British pound is expected to continue its sideways movement along the resistance zone. In the second half, an increase in activity, reversal, and resumption of the bearish course of price movement can be expected. The calculated support is located at the upper boundary of a strong reversal zone.
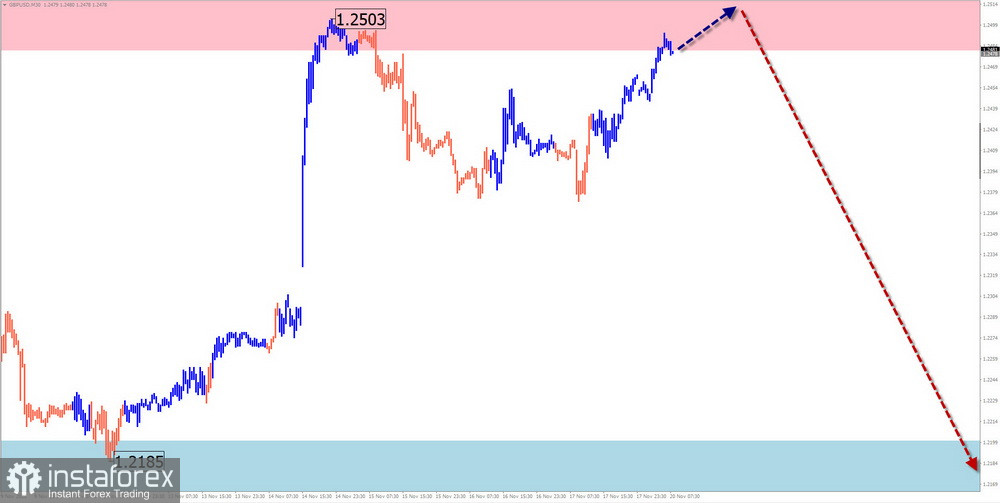
Potential reversal zones:
Resistance:
- 1.2480/1.2520
Support:
- 1.2200/1.2150
Recommendations:
Selling: After confirmed reversal signals appear in the support zone, they can be used for trading.
Buying: Due to the small upward potential, it may involve risks.
AUD/USD
Brief analysis:
On the chart of the main pair of the Australian dollar, the upward movement of the price, which began in early October, continues. On the daily timeframe, this segment forms a correction. The current wave level does not exceed the size of the correction. The structure looks complete. The descending segment from November 15 has a reversal potential.
Weekly forecast:
The bullish course of the pair may end in the next couple of days. A reversal and a resumption of the price decline can be expected in the resistance zone. The greatest activity is expected in the second half of the week.
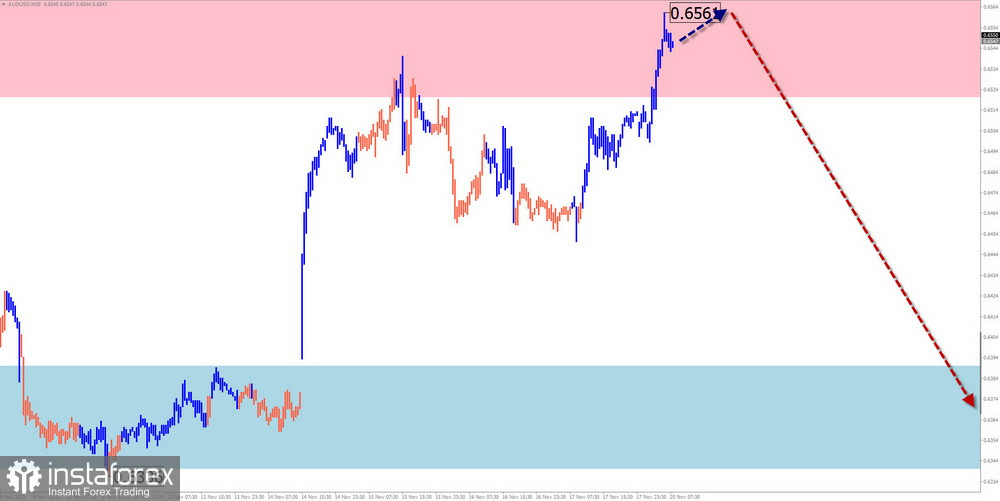
Potential reversal zones:
Resistance:
- 0.6520/0.6570
Support:
- 0.6390/0.6340
Recommendations:
Selling: Will become relevant after the appearance of signals from your trading systems in the resistance zone.
Buying: There will be no conditions for transactions next week.
USD/CHF
Brief analysis:
At the end of the bearish trend since mid-July, an ascending correction is forming on the chart of the major pair of the Swiss franc. By now, its structure is developing the middle part (B). There are no signals of an imminent reversal on the chart. Quotes are approaching the upper boundary of a wide potential reversal zone on a larger timeframe.
Weekly forecast:
The completion of the descending vector of the pair is expected in the next couple of days. Then, in the area of the calculated support, a flat mood is likely to be set, creating conditions for a change in direction. The resumption of the course increase is likely by the end of the week. The calculated resistance passes along the upper boundary of the senior timeframe's strong potential reversal zone.
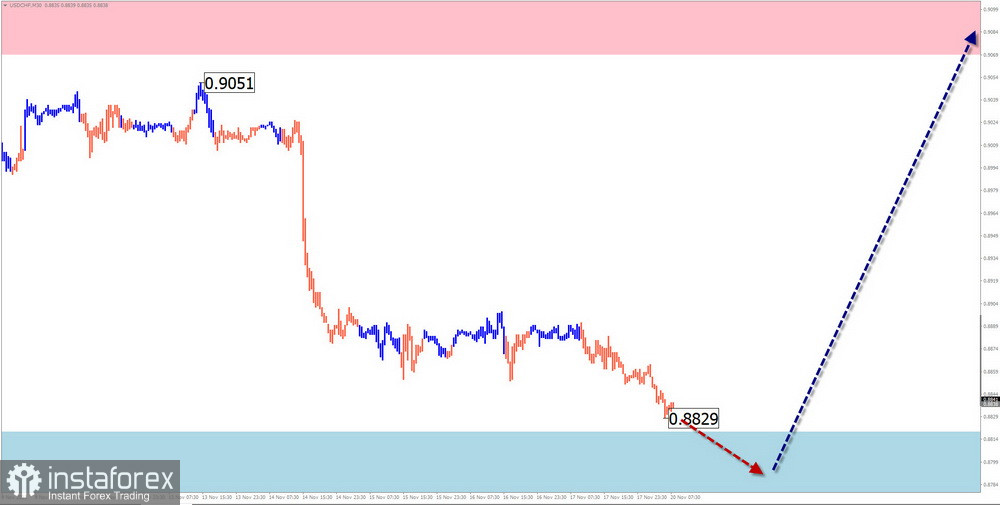
Potential reversal zones:
Resistance:
- 0.9070/0.9120
Support:
- 0.8820/0.8770
Recommendations:
Buying: Will become relevant after the appearance of confirmed reversal signals in the resistance zone.
Selling: This has a small potential and may lead to losses in the deposit.
EUR/JPY
Brief analysis:
In the short term, the price movement direction for the euro/Japanese yen cross is determined by an ascending wave from October 3. In the wave structure, the middle part of wave (B) is developing on a horizontal plane in the last week. In some signs, the movement is approaching completion. However, there are no reversal signals on the chart.
Weekly forecast:
An overall sideways course can be expected at the beginning of the upcoming week. A descending vector is possible, with the price moving down no further than the support boundaries. A change in direction is expected by the end of the week. The calculated resistance represents the upper boundary of the expected weekly course of the instrument.
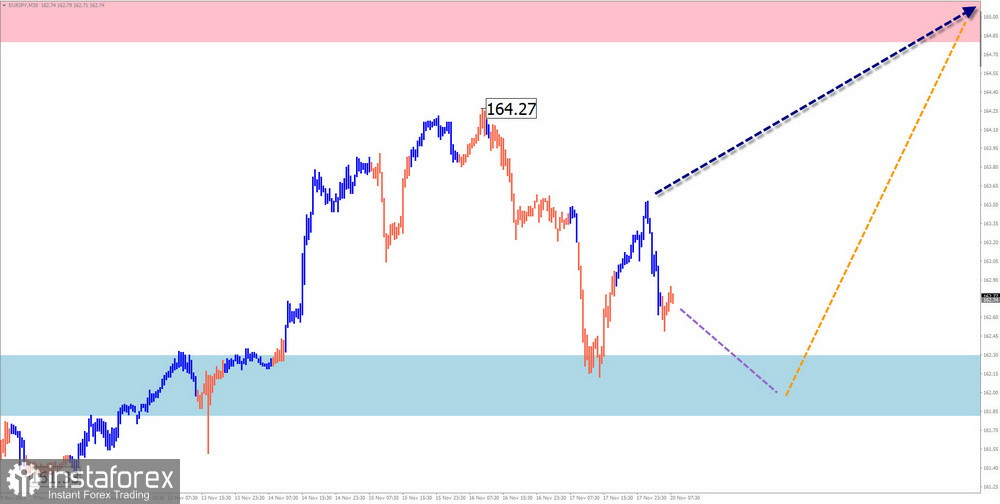
Potential reversal zones:
Resistance:
- 164.80/165.30
Support:
- 162.30/161.80
Recommendations:
Selling: Possible with a small lot in separate sessions, with the potential to decrease to the support zone.
Buying: After confirmed reversal signals appear, they can be used for trading.
EUR/CHF
Brief analysis:
The direction of short-term fluctuations in the euro/Swiss franc pair's exchange rate has been set by the algorithm of a descending wave since January. Since September 20, a wave with reversal potential has been developing. Throughout this month, the price is correcting, mostly moving sideways.
Weekly forecast:
Next week is expected to continue the overall sideways vector. In the first few days, short-term price declines to the support zone cannot be ruled out. A return to the bullish course is likely closer to the weekend. A breakthrough of calculated zones within the next week is unlikely.
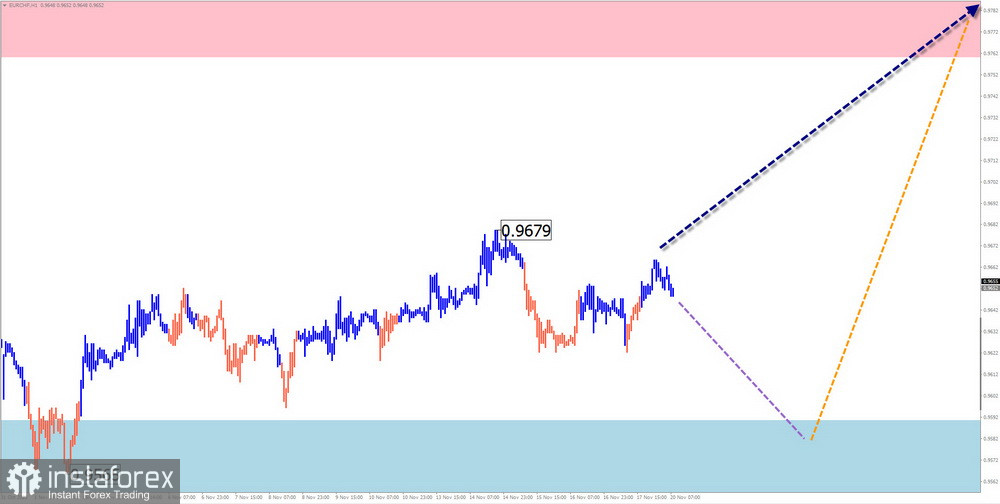
Potential reversal zones:
Resistance:
- 0.9760/0.9810
Support:
- 0.9590/0.9540
Recommendations:
Buying: This may become the main direction of transactions after the appearance of reversal signals in your TF in the support zone.
Selling: Risky and may lead to losses in the deposit.
US dollar index
Brief analysis:
The analysis of the US Dollar Index chart shows the beginning of a bearish trend since October 3. By now, the structure of this wave looks complete. The index quotes have approached the upper boundary of a powerful potential reversal zone on a weekly timeframe. However, there are no signals of an imminent change in course on the chart.
Weekly forecast:
The decline in US dollar quotes may continue in the first half of the week. Closer to the weekend, the probability of a return to the bullish direction and an increase in quotes up to the boundaries of the calculated resistance increases.
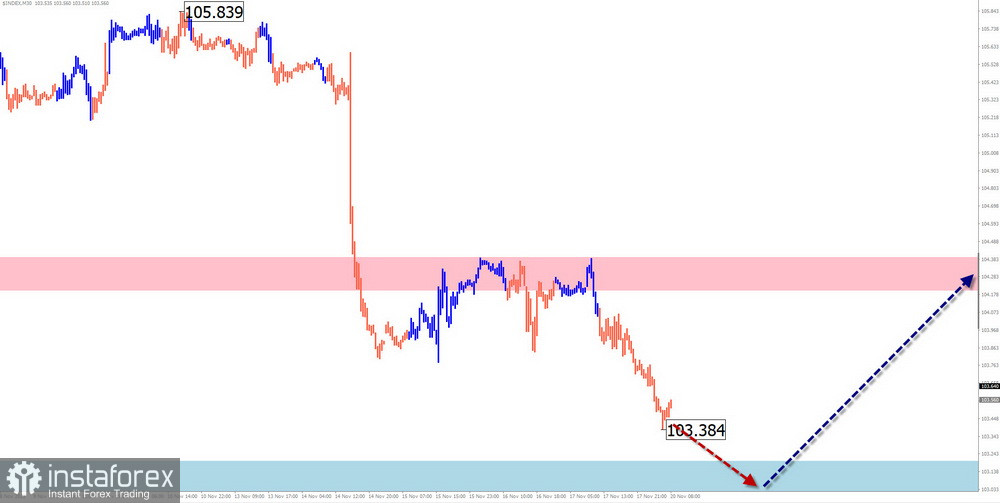
Potential reversal zones:
Resistance:
- 104.20/104.40
Support:
- 103.20/103.00
Recommendations:
Purchases of national currencies in major pairs will be possible only in the next few days. Further, the optimal tactic will be to wait for a reversal in the US dollar and bet on a decrease in major currencies.
Note: In simplified wave analysis (SWA), all waves consist of 3 parts (A-B-C). On each TF, the last unfinished wave is analyzed. Dashed lines indicate expected movements.
Attention: The wave algorithm does not consider the duration of instrument movements over time!