 English
  Русский
 Bahasa Indonesia
 Bahasa Malay
 ไทย
ไทย Español
 Deutsch
 Български
 Français
 Tiếng Việt
 中文
中文 বাংলা
বাংলা हिन्दी
 Čeština
 Українська
 Română

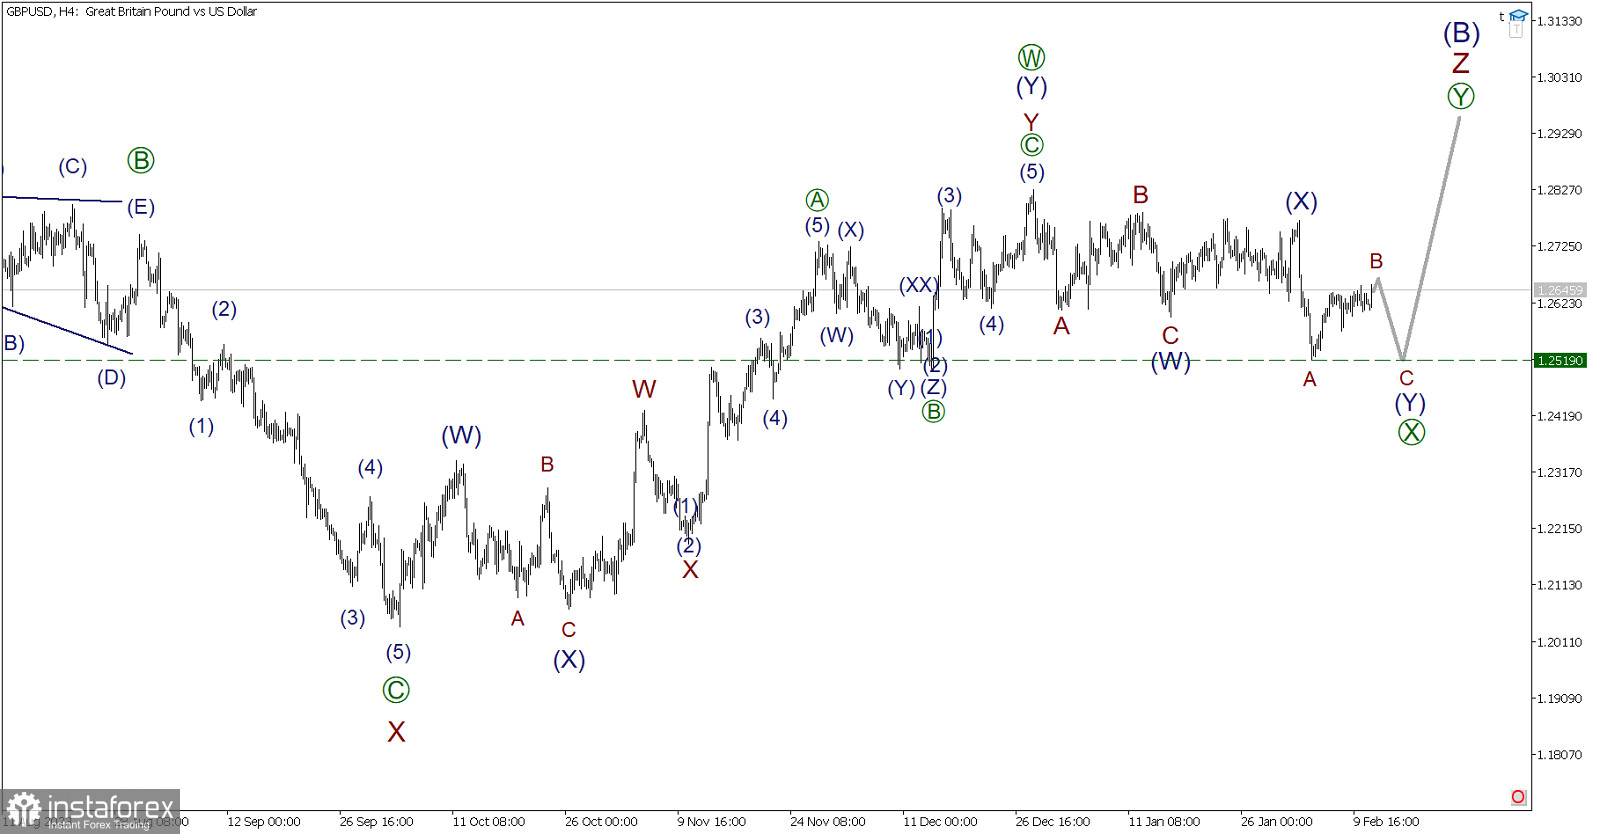
Analyzing the situation on the GBP/USD pair in a four-hour timeframe. In the long-term perspective, a significant correction (B) with a complex internal structure in the form of a triple zigzag may be forming. It is labeled with five sub-waves W-X-Y-X-Z. Currently, the last active sub-wave Z is being formed.
Based on the initial part, the active wave Z seems to take the form of a double zigzag [W]-[X]-[Y]. At the moment, only the bullish wave [W] is completed, consisting of three main sub-waves (W)-(X)-(Y). Since the end of December of the previous year, the market has been moving downward in a correction connecting wave [X].
Most of the connecting wave [X] is already completed. It has the form of a double zigzag (W)-(X)-(Y), for the full completion of which a final impulse wave C is necessary. Within impulse C, the price may fall to the low of 1.2519, marked by sub-wave A. In the current situation, opening short positions can be considered.
It is worth noting today's important news in the United States, which is the Consumer Price Index for January. In recent months, these indicators have not exceeded expectations. Thus, the bearish trend may be confirmed.
Trading recommendation: Sell at 1.2645, take profit at 1.2519.