 English
  Русский
 Bahasa Indonesia
 Bahasa Malay
 ไทย
ไทย Español
 Deutsch
 Български
 Français
 Tiếng Việt
 中文
中文 বাংলা
বাংলা हिन्दी
 Čeština
 Українська
 Română

Trend analysis (Fig. 1).
The EUR/USD currency pair may move upward from the level of 1.0887 (closing of Friday's daily candlestick) to 1.0917, the 50% pullback level (red dotted line). In the case of testing this level, a continued upward movement is possible with a target of 1.0939, the historical resistance level (blue dotted line).
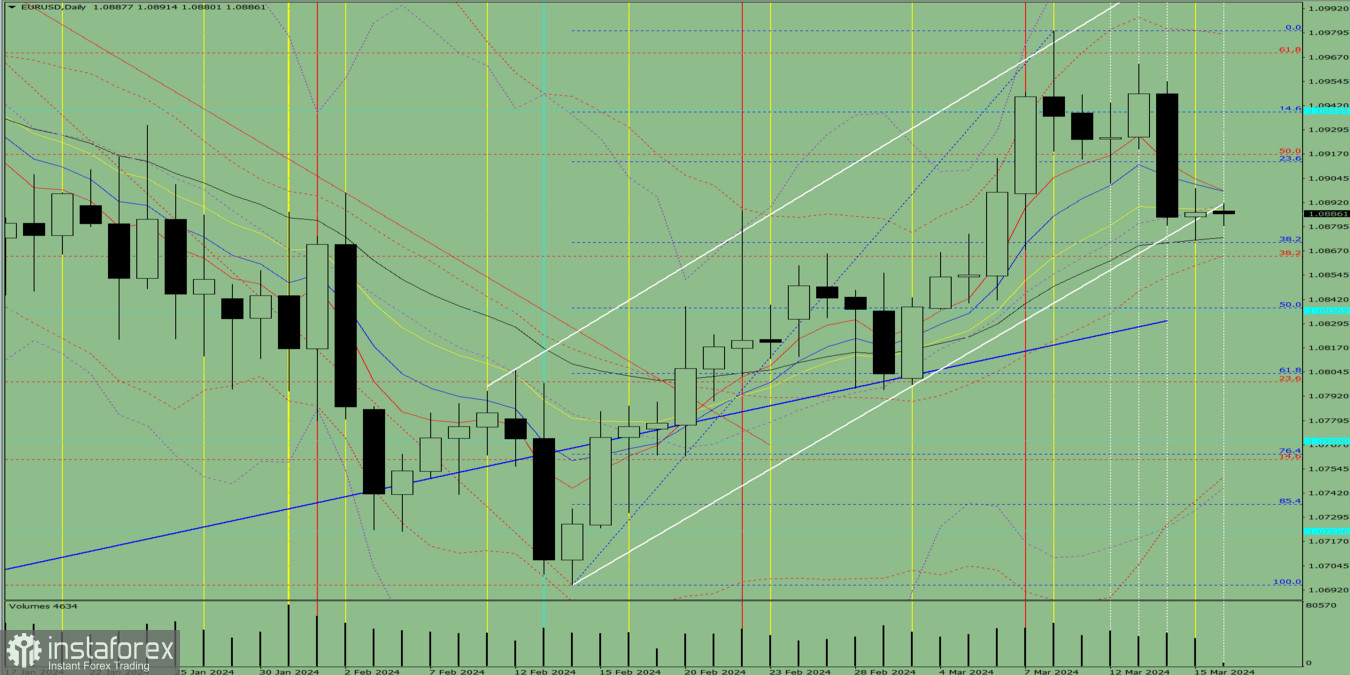
Fig. 1 (daily chart).
Comprehensive analysis:
- Indicator analysis – up;
- Fibonacci levels – up;
- Volumes – up;
- Candlestick analysis – up;
- Trend analysis – up;
- Bollinger bands – up;
- Weekly chart – up.
Today, the price may move upward from the level of 1.0887 (closing of Friday's daily candlestick) to 1.0917, the 50% pullback level (red dotted line). In the case of testing this level, a continued upward movement is possible with a target of 1.0939, the historical resistance level (blue dotted line).
Alternatively, from the level of 1.0887 (closing of Friday's daily candlestick), the price may move downward to 1.0871, the 38.2% pullback level (blue dotted line). In the case of testing this level, an upward movement is possible to 1.0917, the 50% pullback level (red dotted line).