 English
  Русский
 Bahasa Indonesia
 Bahasa Malay
 ไทย
ไทย Español
 Deutsch
 Български
 Français
 Tiếng Việt
 中文
中文 বাংলা
বাংলা हिन्दी
 Čeština
 Українська
 Română

Trend analysis
GBP/USD may start moving upward this week, from the level of 1.2731 (closing price of the last weekly candle) to the 14.6% retracement level of 1.2766 (yellow dashed line). After that it will likely approach the 76.4% retracement level of 1.2880 (red dashed line).
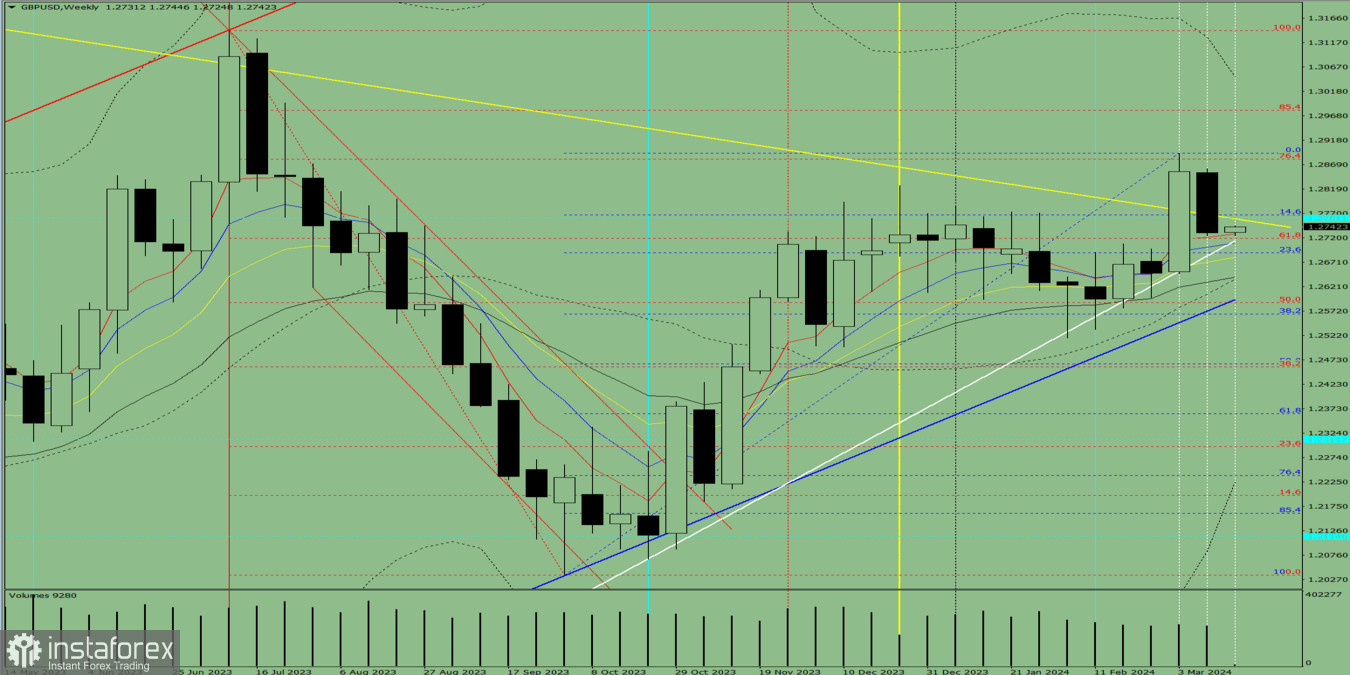
Fig. 1 (weekly chart)
Comprehensive analysis:
Indicator analysis - upward
Fibonacci levels - upward
Volumes - upward
Candlestick analysis - upward
Trend analysis - upward
Bollinger bands - upward
Monthly chart - upward
Conclusion: The indicators point to an upward movement in GBP/USD.
Overall conclusion: The pair will have a bullish trend, with no first lower shadow on the weekly white candle (Monday - upward) and a second upper shadow (Friday - downward).
So, during the week, pound will rise from 1.2731 (closing price of the last weekly candle) to the 14.6% retracement level of 1.2766 (yellow dashed line), and then move towards the 76.4% retracement level of 1.2880 (red dashed line).
Alternatively, it could climb from 1.2731 (closing price of the last weekly candle) to the 14.6% retracement level of 1.2766 (yellow dashed line), followed by a retreat down to the 61.8% retracement level of 1.2719 (red dashed line).