 English
  Русский
 Bahasa Indonesia
 Bahasa Malay
 ไทย
ไทย Español
 Deutsch
 Български
 Français
 Tiếng Việt
 中文
中文 বাংলা
বাংলা हिन्दी
 Čeština
 Українська
 Română

EUR/USD
Higher Timeframes
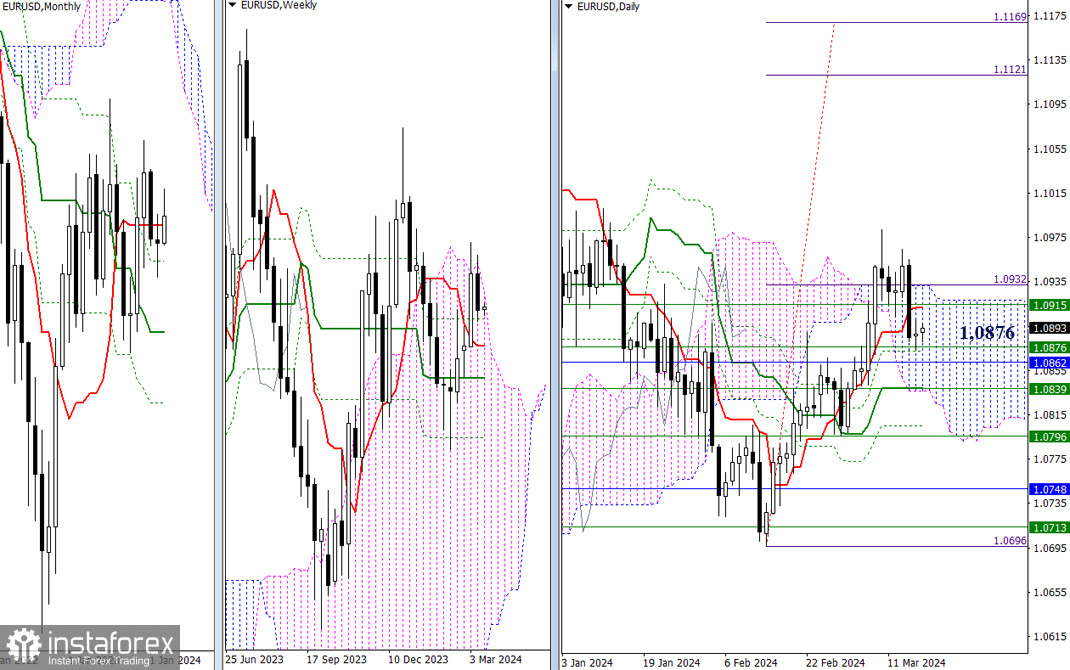
At the end of last week, the pair slowed down, encountering combined support of daily and weekly levels at the 1.0876 mark. The current slowdown could turn into consolidation, but one of the players may show greater activity and take control of the situation. Suppose bullish players manage to seize the opportunity by restoring positions and once again breaking free from the attraction of the daily (1.0932) and weekly (1.0915) Ichimoku clouds. In that case, they may once again raise the question of exiting the current correction zone (1.0982) and continuing the upward trend. If bearish players show activity, they will have no choice but to test and overcome the nearest support zone, consisting of levels 1.0876 - 1.0862 - 1.0839.
H4 - H1
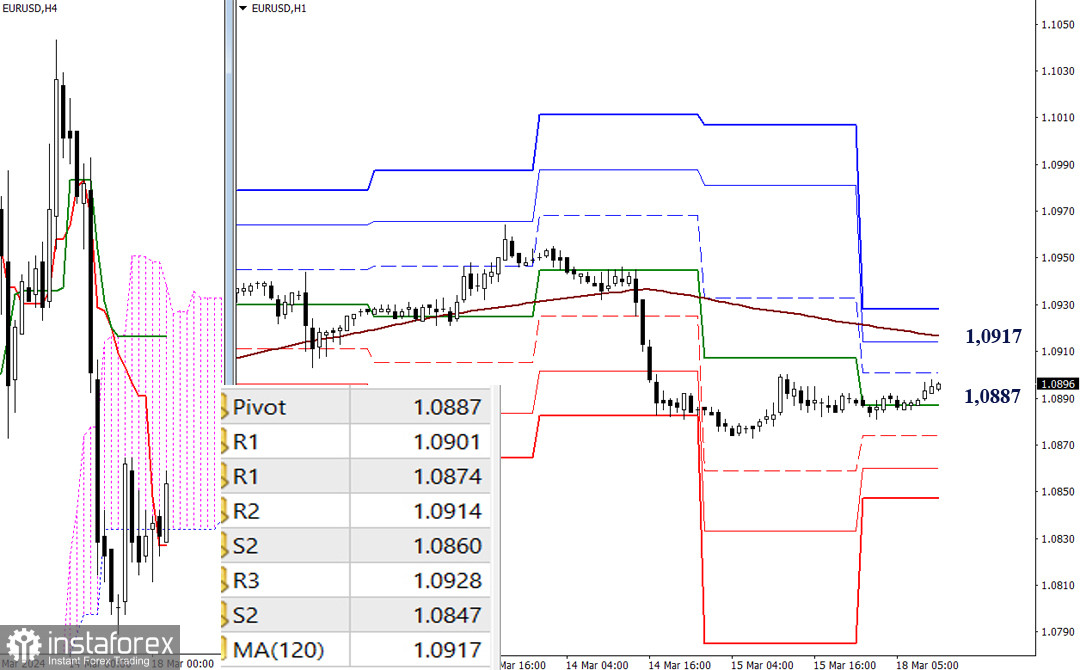
On lower timeframes, despite the prolonged sideways, almost horizontal movement of the pair, the main advantage currently remains on the side of the bearish players. The rise and overcoming of the resistance of the weekly long-term trend (1.0917) could change the current balance of power in favor of the bullish players. However, if the slowdown on the daily chart ends with bearish activity, attention on lower timeframes during the day will be directed towards passing through the support of classic pivot points (1.0887 - 1.0874 - 1.0860 - 1.0847).
***
GBP/USD
Higher Timeframes
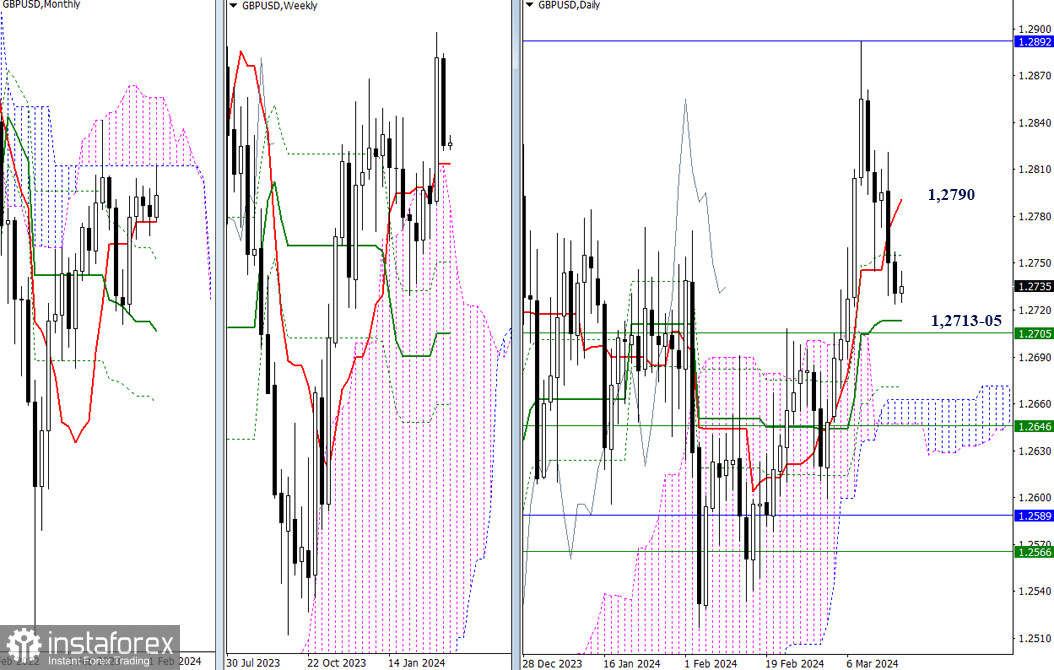
After testing the lower boundary of the monthly cloud (1.2892), the pair experienced a fairly deep decline. As a result, the support of the daily short-term trend, now acting as resistance (1.2790), will meet the market during the retest. Further decline will lead to testing the nearest supports in the area of 1.2705-13 (daily medium-term trend + weekly short-term trend).
H4 - H1
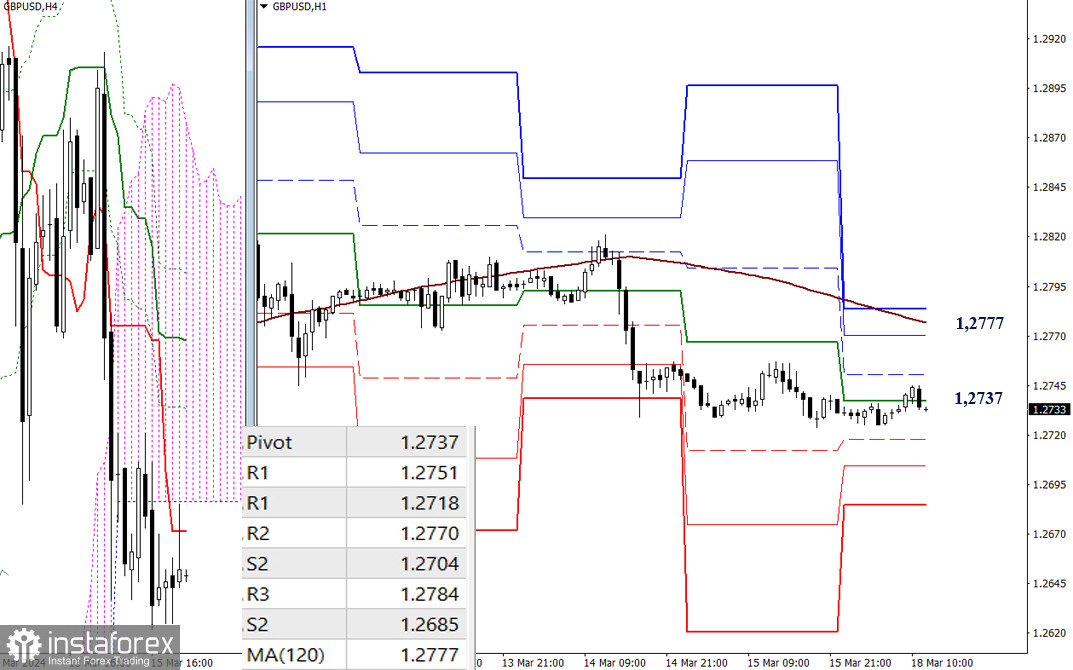
At present, on lower timeframes, the main advantage belongs to the bearish players. Strengthening bearish sentiments during the day will occur through overcoming the support of classic pivot points, located today at 1.2718 - 1.2704 - 1.2685. Changing the current balance of power may occur after the rise and consolidation above the weekly long-term trend (1.2777). Intermediate resistances on this path may today be at R1 (1.2751) and R2 (1.2770).
***
The technical analysis of the situation uses:
Higher timeframes - Ichimoku Kinko Hyo (9.26.52) + Fibonacci Kijun levels
Lower timeframes - H1 - Pivot Points (classic) + Moving Average 120 (weekly long-term trend)