 English
  Русский
 Bahasa Indonesia
 Bahasa Malay
 ไทย
ไทย Español
 Deutsch
 Български
 Français
 Tiếng Việt
 中文
中文 বাংলা
বাংলা हिन्दी
 Čeština
 Українська
 Română

EUR/USD
Higher Timeframes
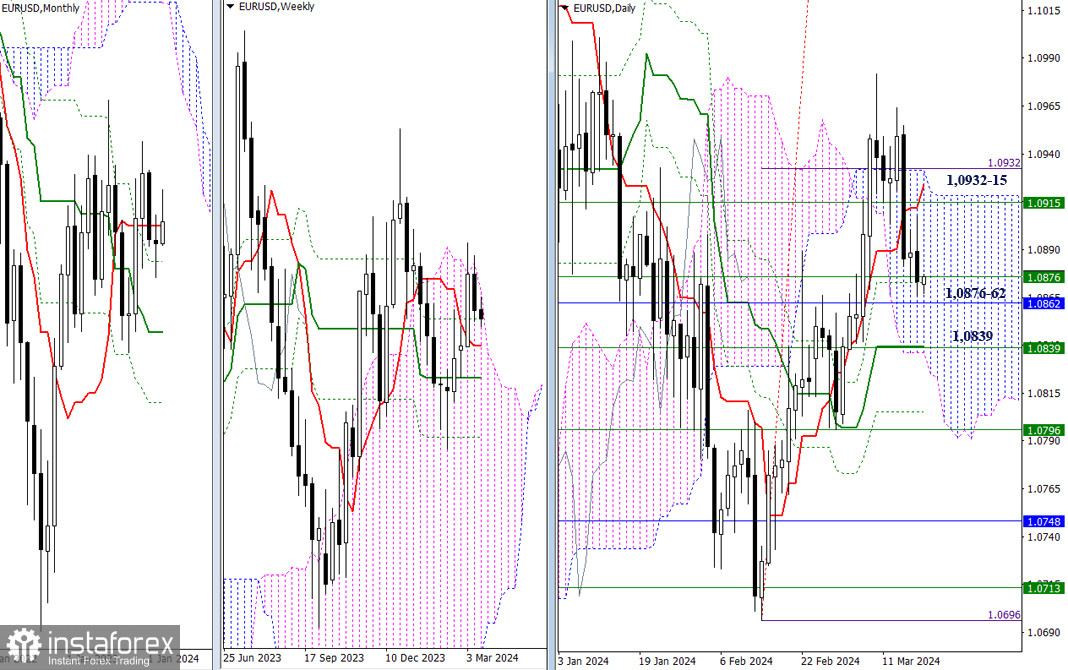
The pair continues testing nearby supports. The zone 1.0876 - 1.0862 - 1.0839 combines many strong levels across various timeframes and is the most important on this section of the chart. Its breakthrough will allow capturing short-term trends of the highest timeframes (weeks and months). Further bearish advancement will raise questions about the elimination of the daily Ichimoku cross and exiting the daily cloud, with the strengthening of these tasks served by the weekly medium-term trend (1.0796).
For bulls, the task remains unchanged. First and foremost, they need to breach into the bullish zone of the daily (1.0932) and weekly (1.0915) Ichimoku clouds. A secure consolidation above will open up new prospects.
H4 - H1
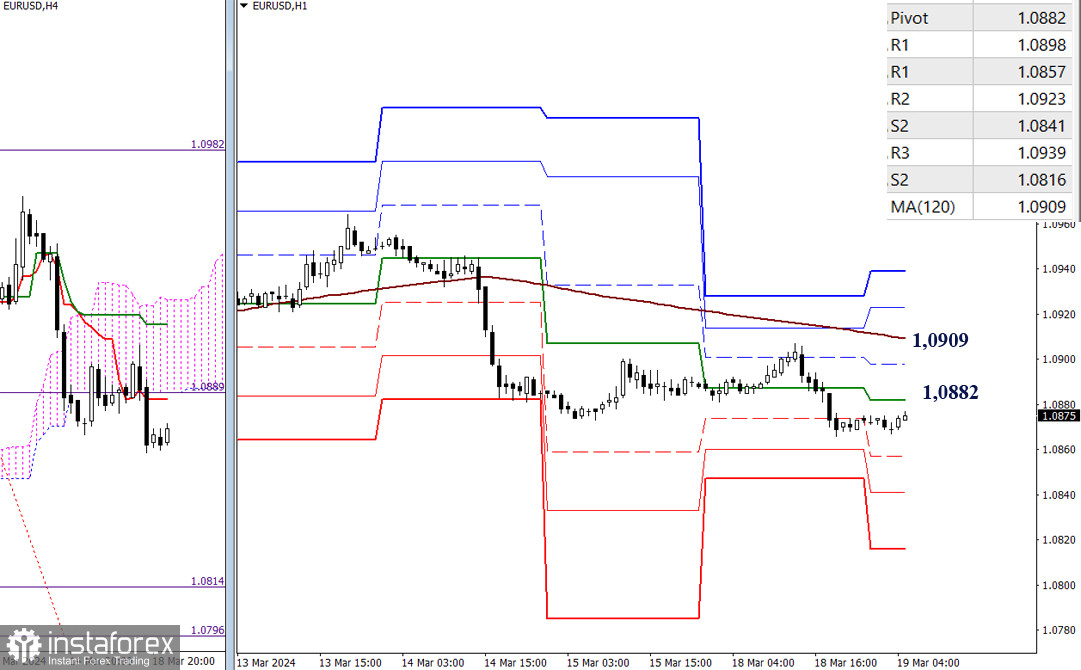
On the lower timeframes, bears managed to strengthen their positions yesterday by updating the nearest low. Today, the reference points for intraday decline continue to be the support levels of the classic pivot points at 1.0857 - 1.0841 - 1.0816. Additionally, a new downward target has been formed for breaking the H4 cloud, with targets in the event of bearish sentiment development at 1.0814 - 1.0796.
The key levels of the lower timeframes now act as resistances, lying at the boundaries of 1.0882 (central pivot point of the day) - 1.0909 (weekly long-term trend). A breakthrough and consolidation above can alter the current balance of power, directing attention towards further strengthening of bullish sentiments.
***
GBP/USD
Higher Timeframes
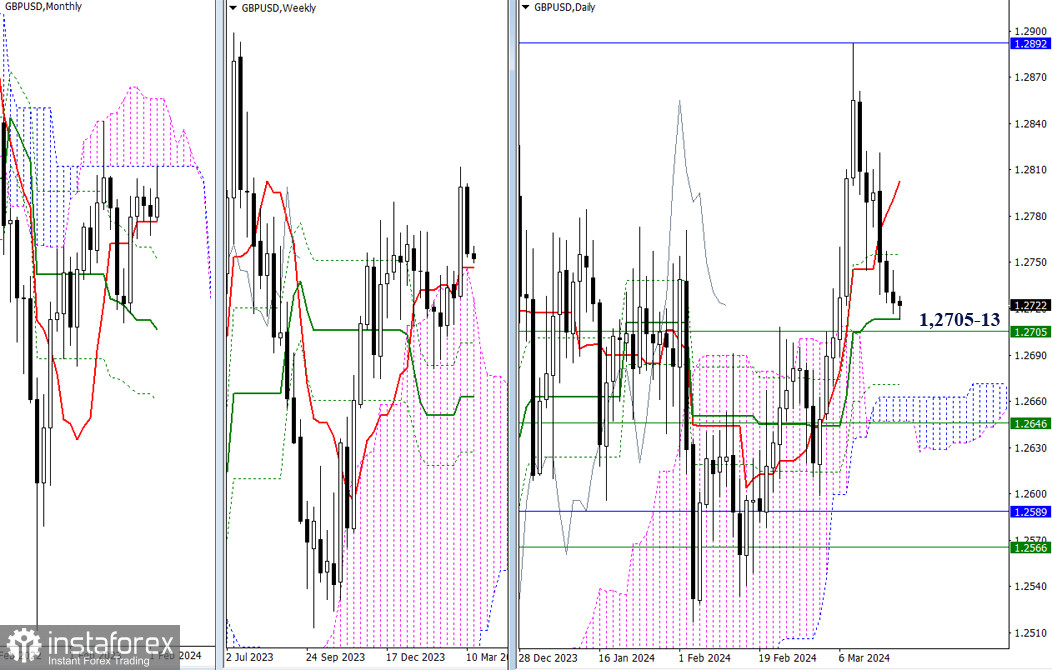
The pair has slowly descended towards the supports of the daily medium-term trend (1.2713) and the weekly short-term trend (1.2705). For bears, breaking these supports is an important stage towards further decline. In the event of a change in priorities, a return to the market by buyers may contribute to the restoration of bullish positions, but the depth of the current decline is unlikely to be overcome quickly. The first obstacles for bulls will be the daily resistances at 1.2755 and 1.2803.
H4 - H1
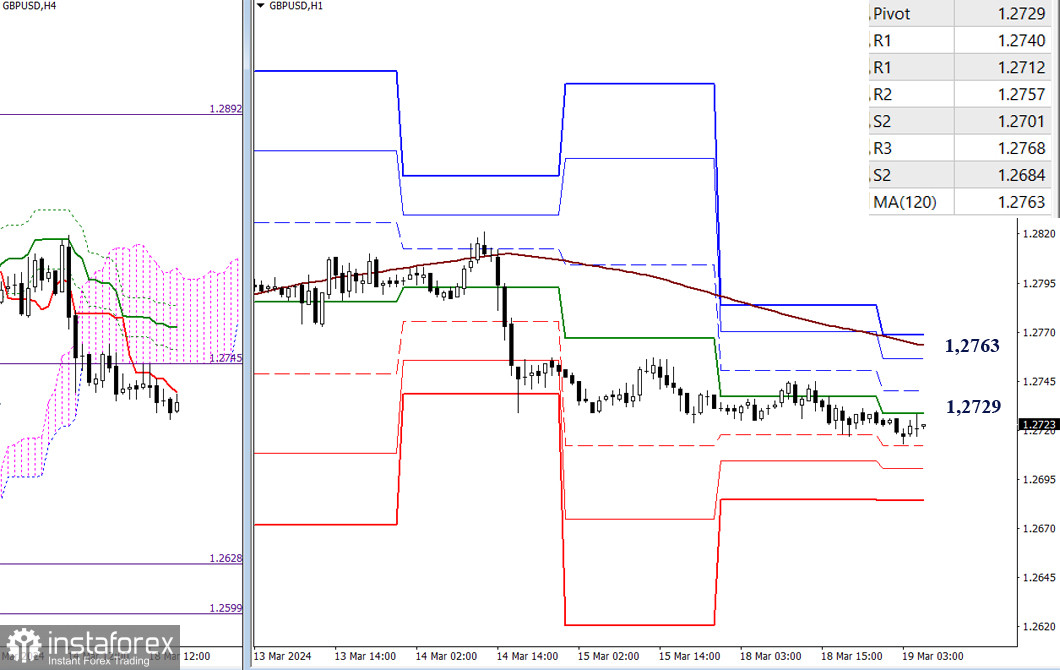
On the lower timeframes, the main advantage continues to belong to bears as they persist in a slow descent. Today, the reference points for decline are the support levels of the classic pivot points (1.2712 - 1.2701 - 1.2684) and the downward target for breaking the H4 cloud (1.2688 - 1.2599). In the event of bullish activity, the recovery of positions by buyers under current conditions will pass through the key levels of the lower timeframes 1.2729 (central pivot point of the day) - 1.2763 (weekly long-term trend), with intermediate resistance possibly provided by the classic pivot points R1 (1.2740) and R2 (1.2757).
***
The technical analysis of the situation uses:
Higher timeframes - Ichimoku Kinko Hyo (9.26.52) + Fibonacci Kijun levels
Lower timeframes - H1 - Pivot Points (classic) + Moving Average 120 (weekly long-term trend)