 English
  Русский
 Bahasa Indonesia
 Bahasa Malay
 ไทย
ไทย Español
 Deutsch
 Български
 Français
 Tiếng Việt
 中文
中文 বাংলা
বাংলা हिन्दी
 Čeština
 Українська
 Română

EUR/USD
Higher Timeframes
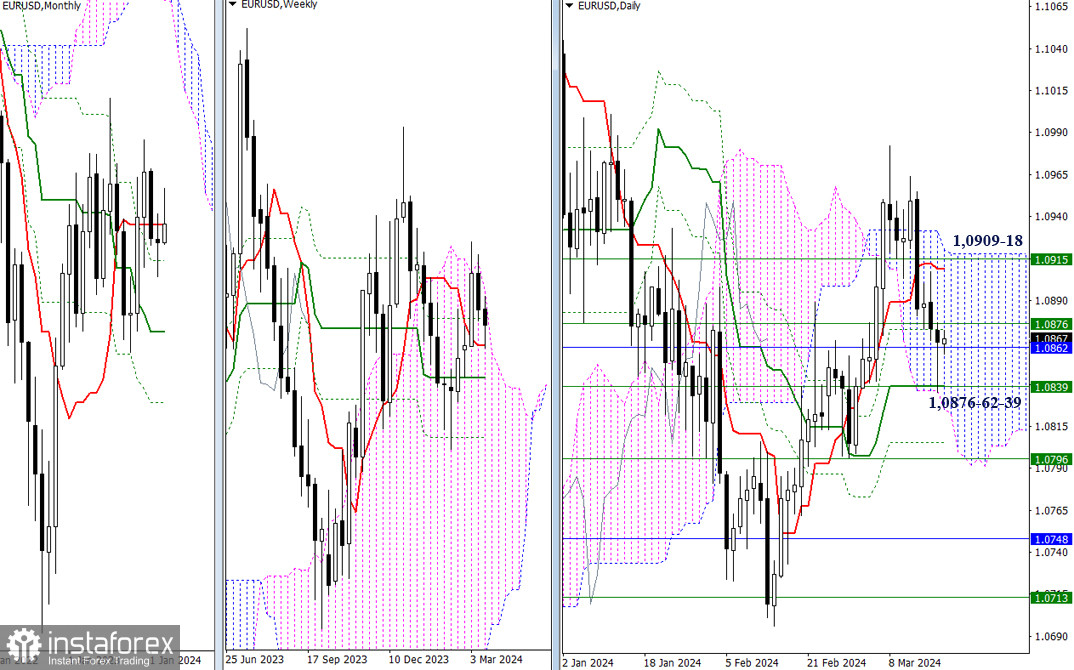
During the previous trading session, bearish players reached and were able to test the crucial milestone of 1.0839, which consolidated several significant levels across different timeframes. However, the day's outcome was once again fixed within the attraction zone of 1.0876 – 1.0862. As a result, the primary task for bearish players remained the same. New bearish targets and plans can only emerge after bearish players manage to overcome the supports at 1.0876 – 1.0862 – 1.0839 and consolidate below.
For bullish players, the benchmarks remain unchanged, situated around 1.0909 – 1.0915 – 1.0918 (daily short-term trend + upper boundaries of the daily and weekly Ichimoku clouds).
H4 – H1
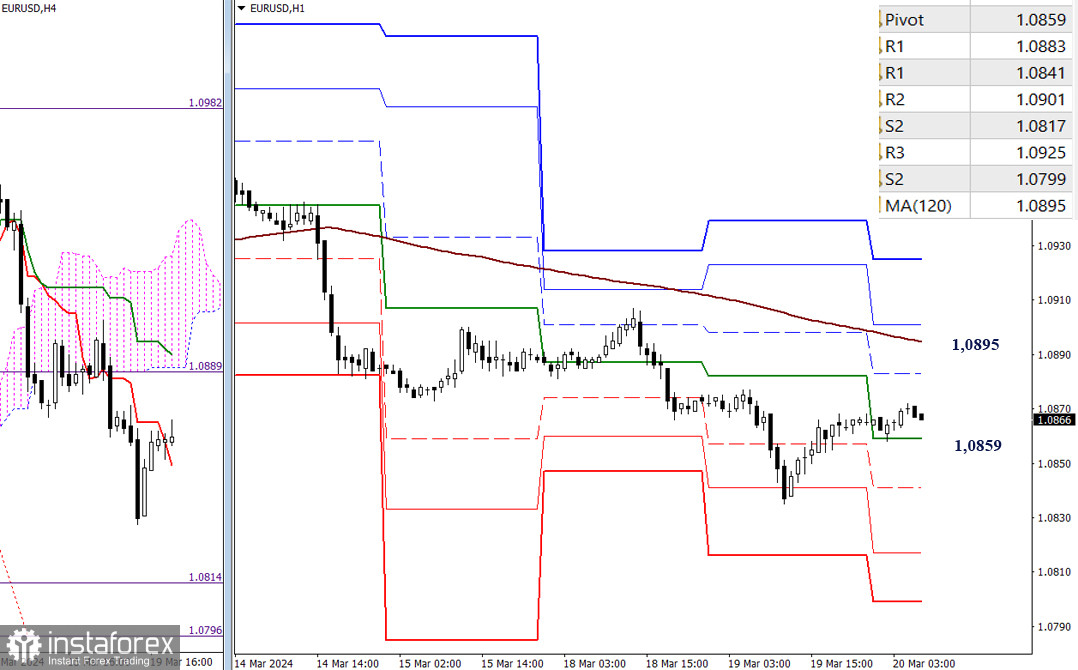
On lower timeframes, a corrective upward movement is currently unfolding, with the weekly long-term trend (1.0895) serving as the main reference point. It should be noted that the key level of lower timeframes today is positioned above the current zone of influence of higher timeframes, so a breakthrough and trend reversal could align with the possibilities of higher timeframes, creating good conditions for changing the current balance of power. The next targets for the upward movement within the day will be the resistances of the classic pivot points R2 (1.0901) and R3 (1.0925).
The development of bearish sentiments within the day in the current situation may involve passing through the supports of classic pivot points (1.0859 – 1.0841 – 1.0817 – 1.0799).
***
GBP/USD
Higher Timeframes
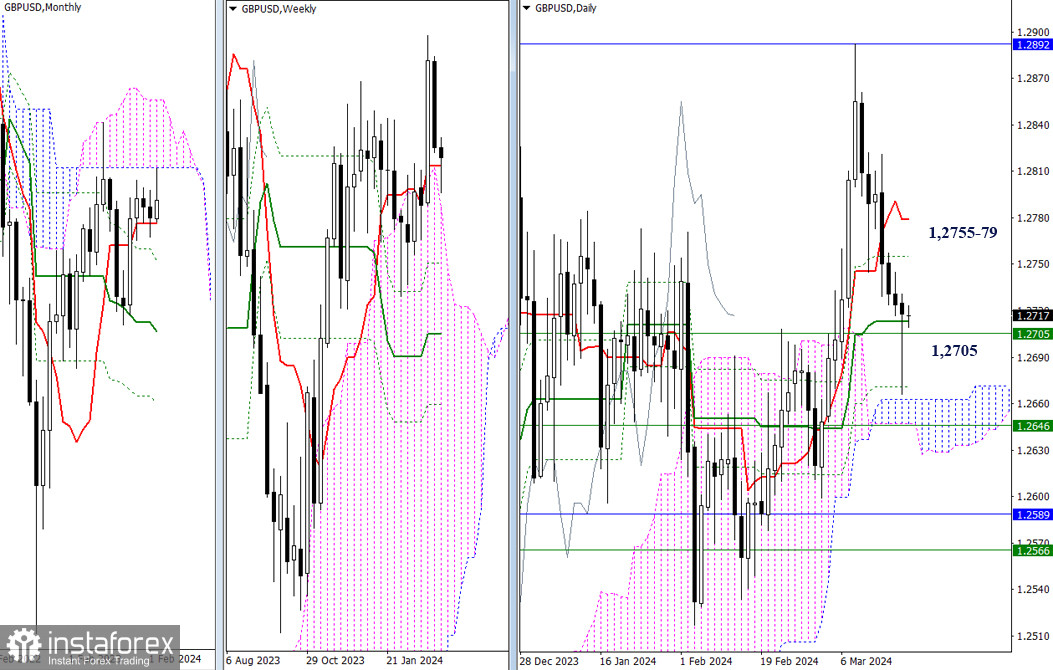
Yesterday, bearish players cast a long lower shadow, reaching the next zone of influence and supports at 1.2671-1.2662, but they had to close the day above the current supports at 1.2713 – 1.2705. Therefore, it can be assumed that the opponent is not ready to yield yet and will continue the struggle.
Confirmation and development of the rebound from the tested supports will redirect the attention of bullish players to the resistances at 1.2755 – 1.2779 (daily Fibonacci Kijun + daily short-term trend).
H4 – H1
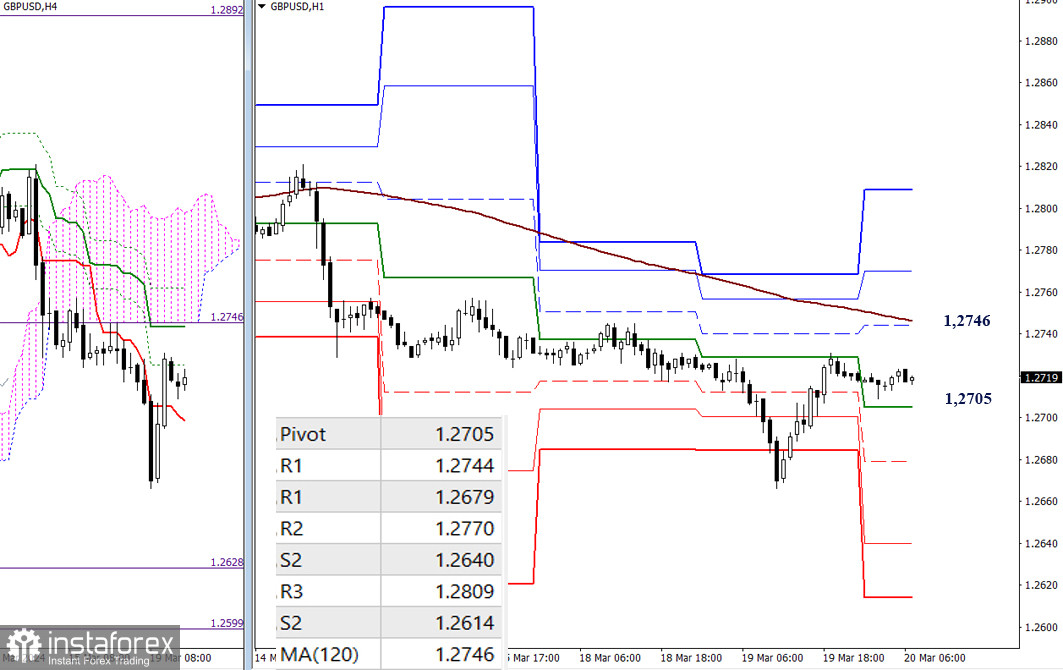
The main advantage on lower timeframes currently continues to favor bearish players. Targets for resuming the decline within the day today are located at the levels of 1.2705 – 1.2679 – 1.2640 – 1.2614 (classic pivot points).
However, if the current corrective upward movement persists, then for a change in the current balance of power, bullish players must break through and reverse the weekly long-term trend (1.2746). Afterward, they will encounter resistances of classic pivot points (1.2770 – 1.2809), reinforced by resistances from higher timeframes (1.2755-79).
***
The technical analysis of the situation uses:
Higher timeframes - Ichimoku Kinko Hyo (9.26.52) + Fibonacci Kijun levels
Lower timeframes - H1 - Pivot Points (classic) + Moving Average 120 (weekly long-term trend)