 English
  Русский
 Bahasa Indonesia
 Bahasa Malay
 ไทย
ไทย Español
 Deutsch
 Български
 Français
 Tiếng Việt
 中文
中文 বাংলা
বাংলা हिन्दी
 Čeština
 Українська
 Română

Despite economists and gold market analysts considering that the price of gold has gone too far, expecting any significant correction in the current situation is not necessary. Moreover, further growth is not excluded until the price reaches new resistance levels.
The expected U.S. PMI indices are unlikely to significantly influence the dynamics of the dollar and the XAU/USD pair unless they come out with outstanding figures.
Gold prices on Thursday reached record highs above the $2,220 per ounce mark, and the XAU/USD pair briefly exceeded the $2,222 mark.
However, we dare to assume that we are unlikely to see new records until Friday, and most likely, there will be some correction while maintaining the overall upward trend.
The forecast and target at the 3000.00 mark remain valid.
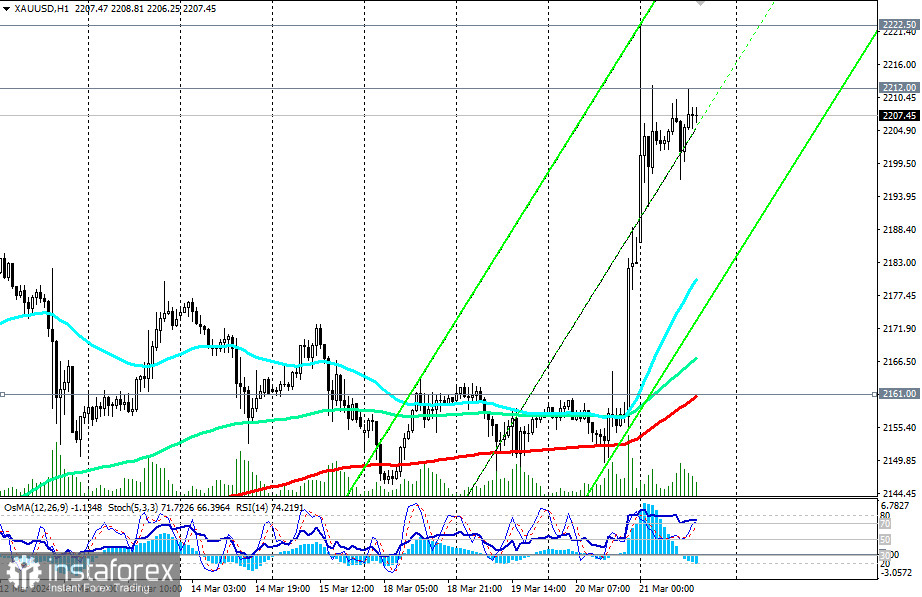
A signal for new long positions will be the breakthrough of the 2222.00 mark. Purchases are also possible on price pullbacks to the support zone around the 2161.00 (200 EMA on the 1-hour chart), 2150.00, and 2145.00 marks.
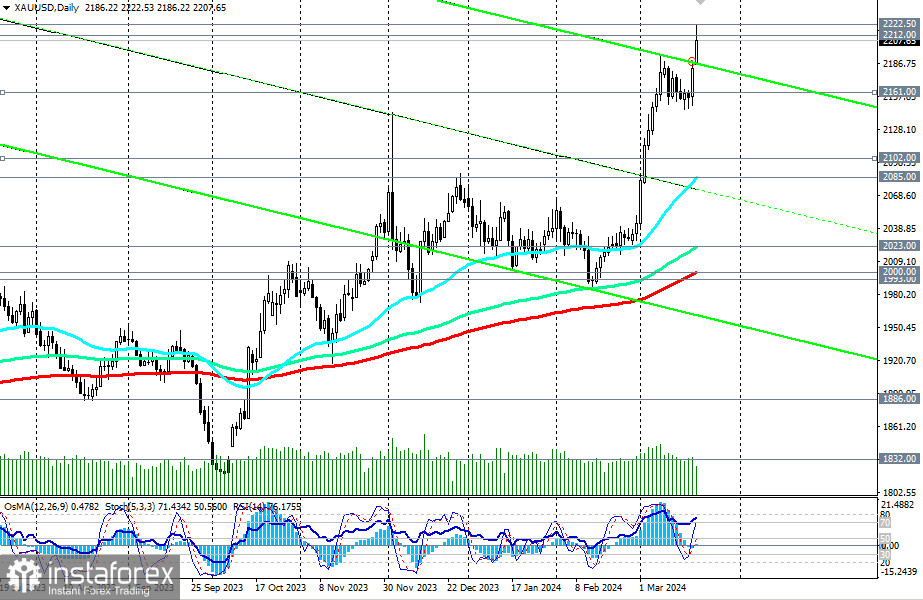
A breakthrough of the 2140.00 mark may trigger a deeper correction towards support levels at 2102.00 (200 EMA on the 4-hour chart) and 2085.00 (50 EMA on the daily chart).
Only after their possible breakthrough can something be planned regarding short positions.
Therefore, for now, we await a new signal and a convenient entry position for the "Buy" strategy.
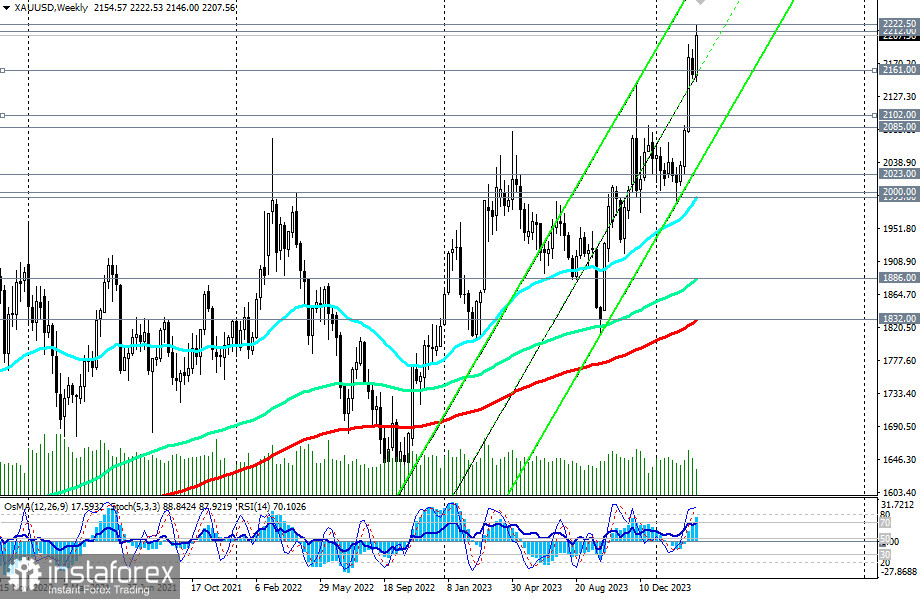
Above the 2000.00 support level (200 EMA on the daily chart), the price remains in the zone of the medium-term bullish market, and above the key support level of 1832.00 (200 EMA on the weekly chart) – in the zone of the long-term bullish market.
Technical indicators RSI, OsMA, and Stochastic on the daily and weekly charts are also on the buyers' side.
Support levels: 2200.00, 2195.00, 2161.00, 2145.00, 2102.00, 2100.00, 2085.00, 2023.00, 2000.00, 1993.00
Resistance levels: 2212.00, 2222.00, 2300.00
Trading scenarios:
Main scenario: Buy Stop at 2214.00. Stop-Loss at 2195.00. Targets: 2222.00, 2300.00, 3000.00
Alternative scenario: Sell Stop at 2195.00. Stop-Loss at 2214.00. Targets: 2161.00, 2145.00, 2102.00, 2100.00, 2085.00, 2023.00, 2000.00, 1993.00
"Targets" correspond to support/resistance levels. This also does not mean that they will necessarily be reached but can serve as a guide when planning and placing your trading positions.