 English
  Русский
 Bahasa Indonesia
 Bahasa Malay
 ไทย
ไทย Español
 Deutsch
 Български
 Français
 Tiếng Việt
 中文
中文 বাংলা
বাংলা हिन्दी
 Čeština
 Українська
 Română

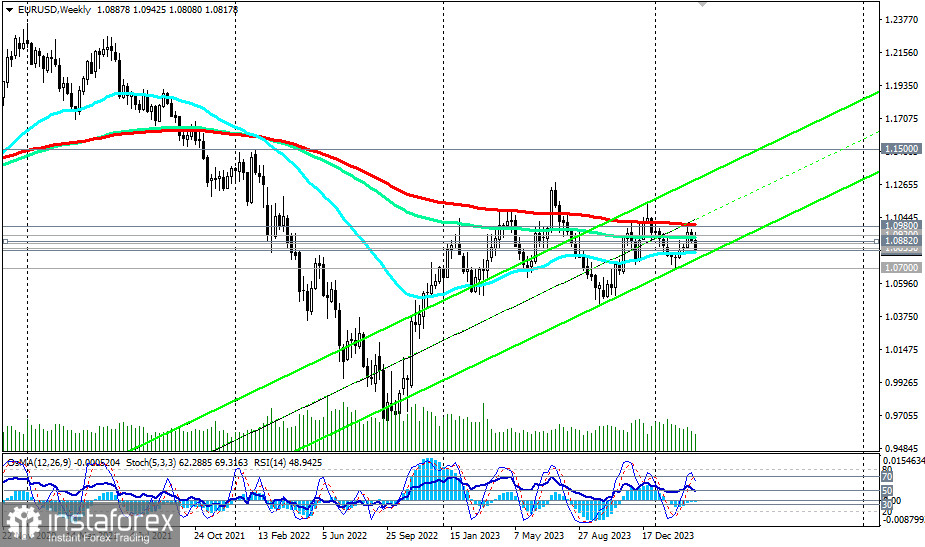
At the start of the month, EUR/USD tested the critical resistance level of 1.0980 (200 EMA on the weekly chart). Following this, the currency pair shifted into a decline. Consequently, as the final week of the month and quarter commenced, EUR/USD once more descended to the medium-term balance line and the key support level of 1.0820 (200 EMA on the daily chart). Above this level, the price is in the zone of the medium-term bullish market.
Its breakthrough will make short-term medium-term positions predominant, while EUR/USD remains in the long-term bearish market zone.
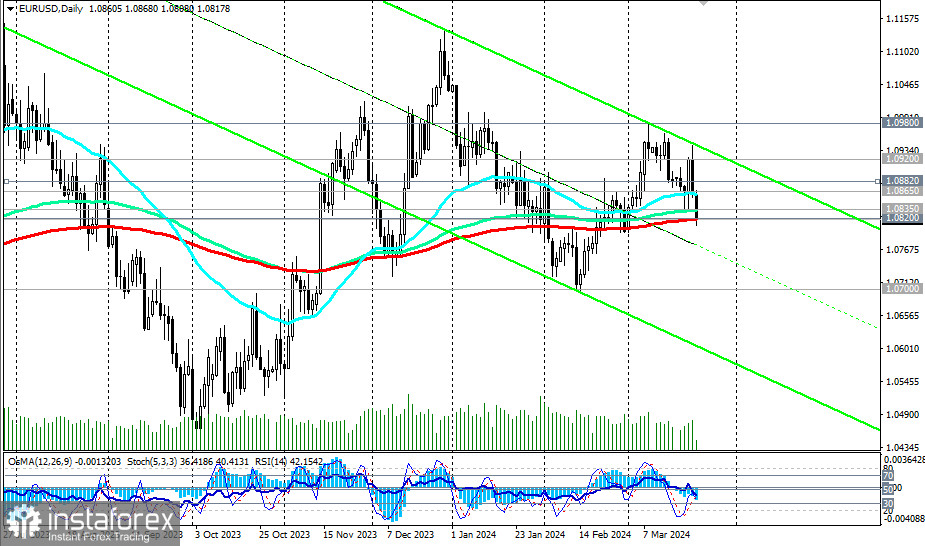
It is worth noting that the technical indicators RSI, OsMA, and Stochastic on the daily chart are already on the sellers' side, and on the weekly chart, they are turning towards short positions.
Therefore, considering also the increasingly strengthening dollar, in the main scenario, we expect a breakthrough of the levels 1.0820 and 1.0800 and further decline into the depths of the downward channel on the daily chart, towards its lower boundary and the level of 1.0600. The intermediate target in this case is the local support level of 1.0700.
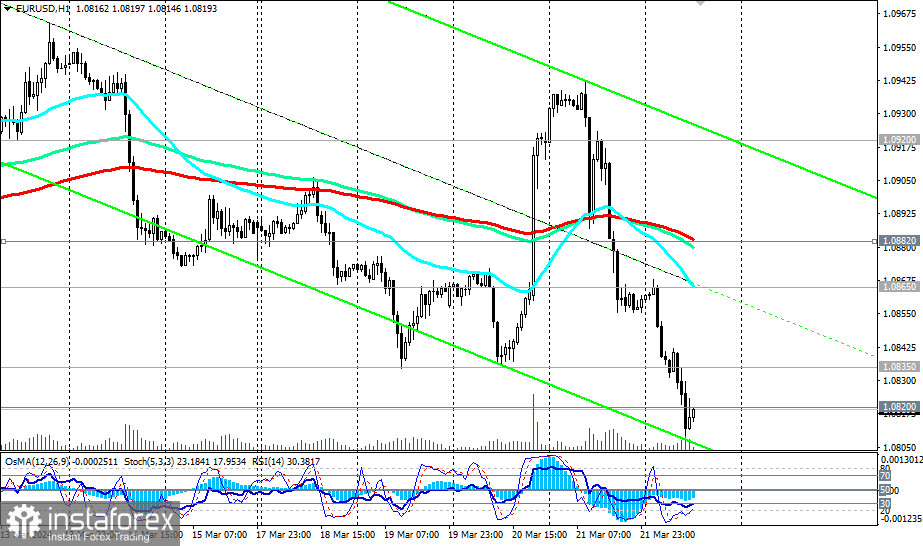
In the alternative scenario, the first signal for the resumption of long positions may be the breakthrough of the resistance level of 1.0835 (144 EMA on the daily chart). If pressure on the euro persists, the peak of corrective growth can be expected no higher than the resistance levels of 1.0882 (200 EMA on the 1-hour chart) and 1.0900. In any case, short long-term positions remain preferable below the resistance levels of 1.0980 and 1.1000.
Support levels: 1.0820, 1.0800, 1.0700, 1.0660, 1.0600, 1.0530, 1.0500, 1.0450, 1.0400, 1.0300
Resistance levels: 1.0835, 1.0865, 1.0882, 1.0900, 1.0920, 1.0980, 1.1000, 1.1040, 1.1090, 1.1100, 1.1140, 1.1200, 1.1275, 1.1300, 1.1400, 1.1500
Trading scenarios:
Main scenario: Sell Stop 1.0790. Stop-Loss 1.0845. Targets 1.0700, 1.0660, 1.0600, 1.0530, 1.0500, 1.0450, 1.0400, 1.0300
Alternative scenario: Buy Stop 1.0845. Stop-Loss 1.0790. Targets 1.0865, 1.0882, 1.0900, 1.0920, 1.0980, 1.1000, 1.1040, 1.1090, 1.1100, 1.1140, 1.1200, 1.1275, 1.1300, 1.1400, 1.1500
"Targets" correspond to support/resistance levels. This also does not mean that they will necessarily be reached, but they can serve as a reference point when planning and placing your trading positions.