 English
  Русский
 Bahasa Indonesia
 Bahasa Malay
 ไทย
ไทย Español
 Deutsch
 Български
 Français
 Tiếng Việt
 中文
中文 বাংলা
বাংলা हिन्दी
 Čeština
 Українська
 Română

EUR/USD
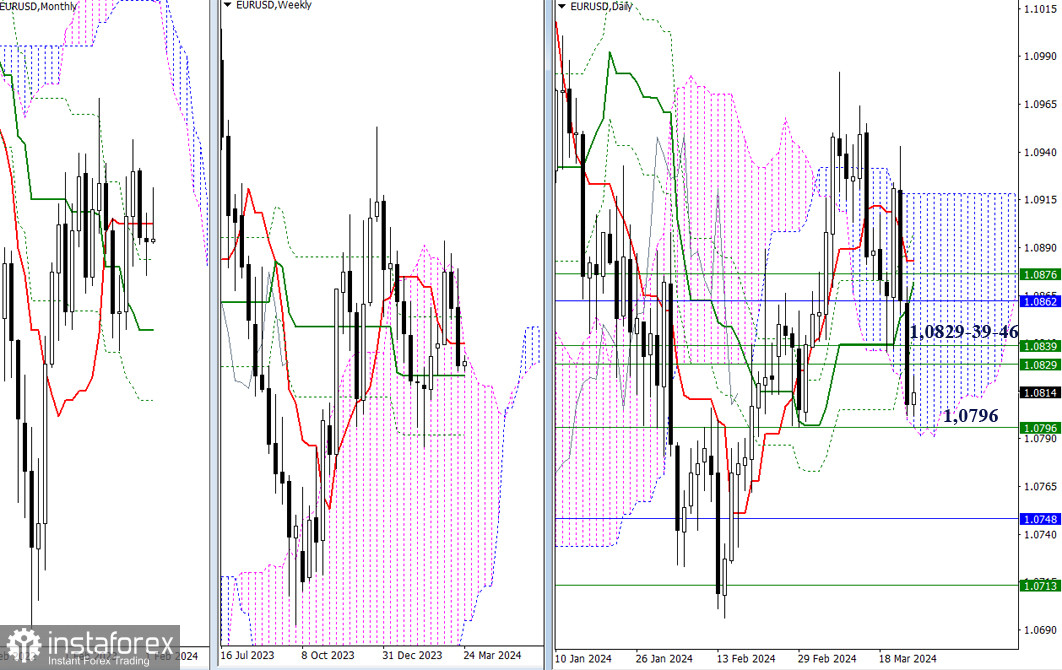
Higher Timeframes
Last week recorded a bearish outcome. Now, to solidify it and continue the decline, bearish players must exit the daily cloud (1.0792) and firmly consolidate in the bearish zone of the relative cloud, simultaneously overcoming the area of attraction and influence of the weekly medium-term trend (1.0796). After that, new prospects will open up for them in the form of monthly support (1.0748) and the final level of the golden cross of the weekly Ichimoku cloud (1.0713).
If bears now take a pause, the recovery of bullish positions will primarily pass through two important resistance areas 1.0829-39-46 and 1.0862-76-83. The first boundaries will allow the return of the weekly short-term trend and re-establishment in the bullish zone relative to the weekly cloud, while the second area will facilitate the transition to the bullish side of the monthly short-term trend and some weekly and daily levels.
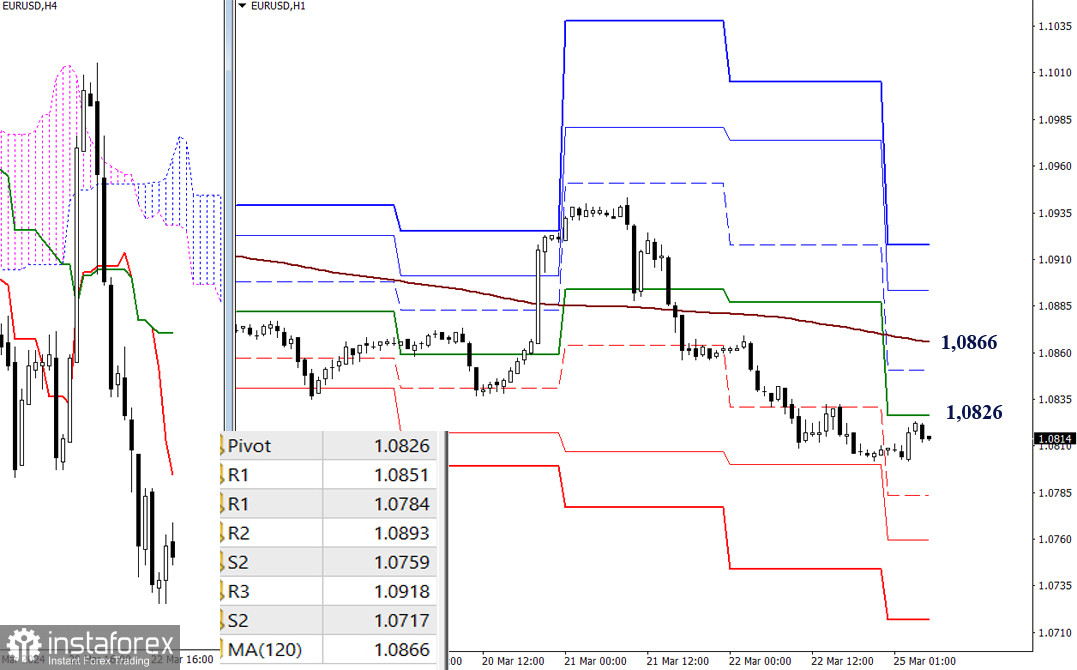
H4 - H1
On lower timeframes, the current main advantage belongs to bearish players. However, the pair is currently in a corrective upward trend, with the key levels of lower timeframes today located at 1.0826 (central pivot point of the day) and 1.0866 (weekly long-term trend). Consolidation above will change the current balance of power, directing attention higher towards the resistances of classic pivot points (1.0893 - 1.0918).
The bearish scenario, after exiting the correction zone, will pass through the passage of supports of classic pivot points (1.0784 - 1.0759 - 1.0717).
***
GBP/USD
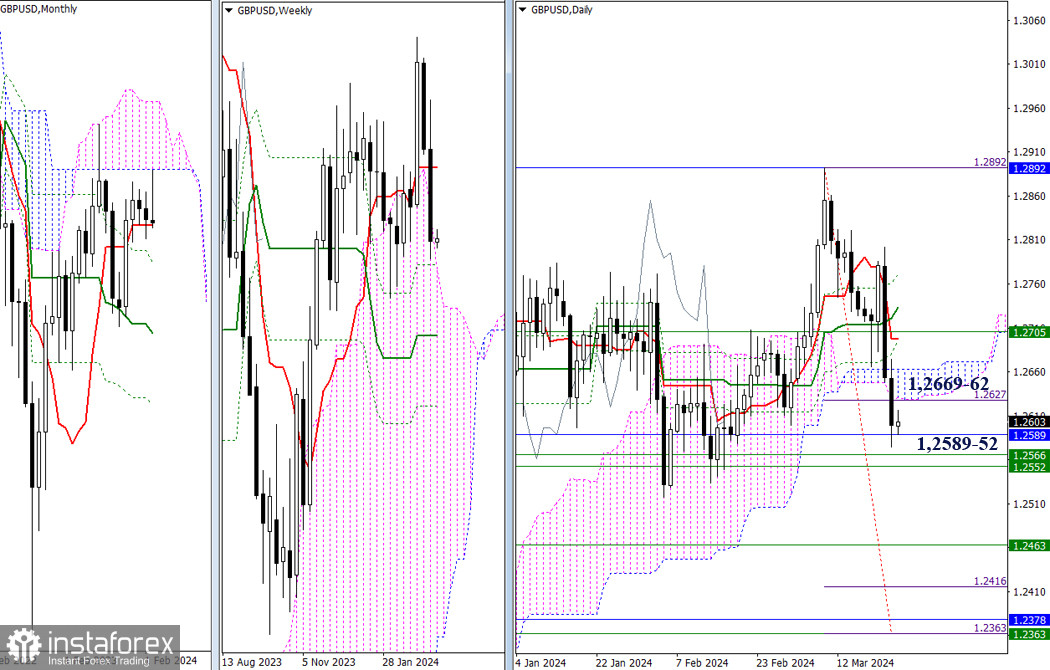
Higher timeframes
Bearish players last week managed to break out of the daily bearish Ichimoku cloud. In addition, they began testing the reinforced support area of 1.2589-66-52 (weekly and monthly levels). The result of this interaction may determine the course of events in the near term. A breakout will allow considering such prospects as achieving the daily target for breaking the Ichimoku cloud and liquidating the golden cross of the weekly Ichimoku cloud. A rebound will contribute to a retest of the previously passed daily cloud (1.2629 - 1.2662), while further upward movement will raise questions about the return of support for the weekly short-term trend (1.2705) and the liquidation of the recently formed death cross of the daily Ichimoku cloud.
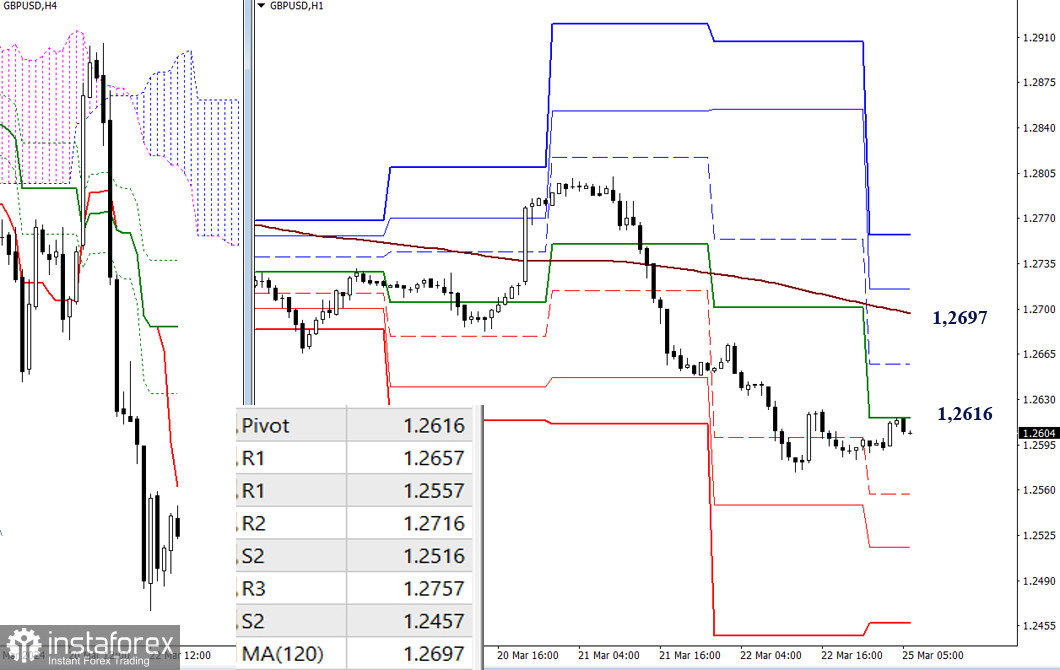
H4 - H1
In the current conditions, bearish players hold the main advantage, although the market is currently in a correction zone. The development of a corrective upward trend will lead the pair to test key levels of lower timeframes - 1.2616 (central pivot point of the day) and 1.2697 (weekly long-term trend). Intermediate resistance on this path may come at R1 (1.2657).
A return to the bear market during the day will lead to testing supports of classic pivot points (1.2557 - 1.2516 - 1.2457).
***
The technical analysis of the situation uses:
Higher timeframes - Ichimoku Kinko Hyo (9.26.52) + Fibonacci Kijun levels
Lower timeframes - H1 - Pivot Points (classic) + Moving Average 120 (weekly long-term trend)