 English
  Русский
 Bahasa Indonesia
 Bahasa Malay
 ไทย
ไทย Español
 Deutsch
 Български
 Français
 Tiếng Việt
 中文
中文 বাংলা
বাংলা हिन्दी
 Čeština
 Українська
 Română

Trend analysis (Fig. 1).
The GBP/USD currency pair may move upward from the level of 1.2632 (closing of yesterday's daily candle) to test the 61.8% pullback level at 1.2661 (yellow dotted line). Upon reaching this level, a continued upward movement is possible to test the 38.2% pullback level at 1.2695 (red dotted line).
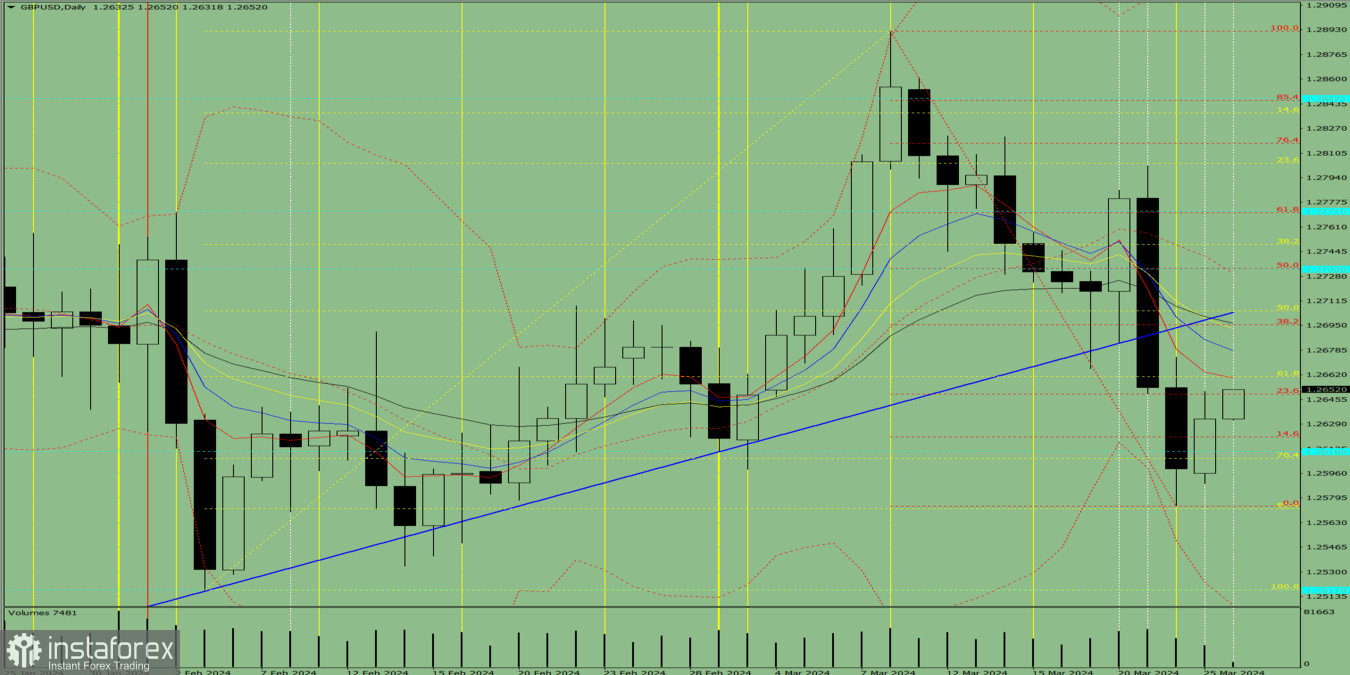
Fig. 1 (daily chart).
Comprehensive analysis:
- Indicator analysis – up;
- Volumes – up;
- Candlestick analysis – up;
- Trend analysis – down;
- Bollinger bands – down;
- Weekly chart – up.
General conclusion: Today, the price may move upward from the level of 1.2632 (closing of yesterday's daily candle) to test the 61.8% pullback level at 1.2661 (yellow dotted line). Upon reaching this level, a continued upward movement is possible to test the 38.2% pullback level at 1.2695 (red dotted line).
Alternatively, from the level of 1.2632 (closing of yesterday's daily candlestick), the price may move upward to test the 61.8% pullback level at 1.2661 (yellow dotted line). Upon reaching this level, a downward movement is possible to test the 23.6% pullback level at 1.2649 (red dotted line).