 English
  Русский
 Bahasa Indonesia
 Bahasa Malay
 ไทย
ไทย Español
 Deutsch
 Български
 Français
 Tiếng Việt
 中文
中文 বাংলা
বাংলা हिन्दी
 Čeština
 Українська
 Română

EUR/USD
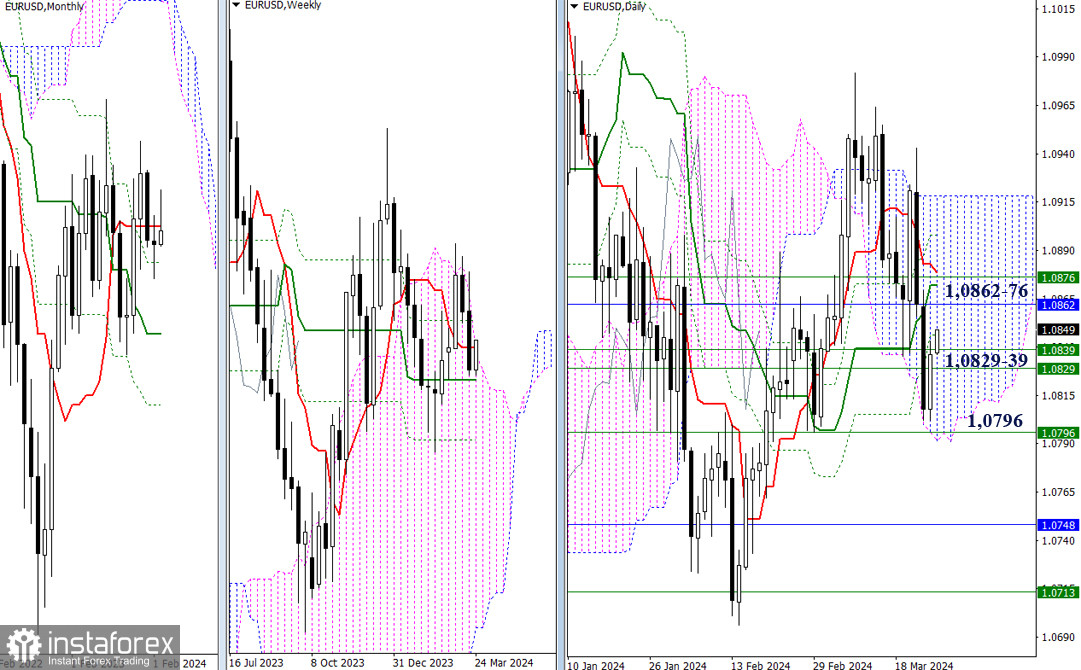
Higher Timeframes
At the opening of the new trading week, bullish players took the initiative. Yesterday, they slightly recovered their positions and executed a retest of the weekly levels (1.0829-39). Now, it is crucial what the outcome of the impending ascent will be. Perhaps the retest will conclude, and bears who took a pause will return to the market, or another scenario may prevail, wherein the bulls continue the ascent and test the accumulation zone of the next resistances at 1.0862 - 1.0876.
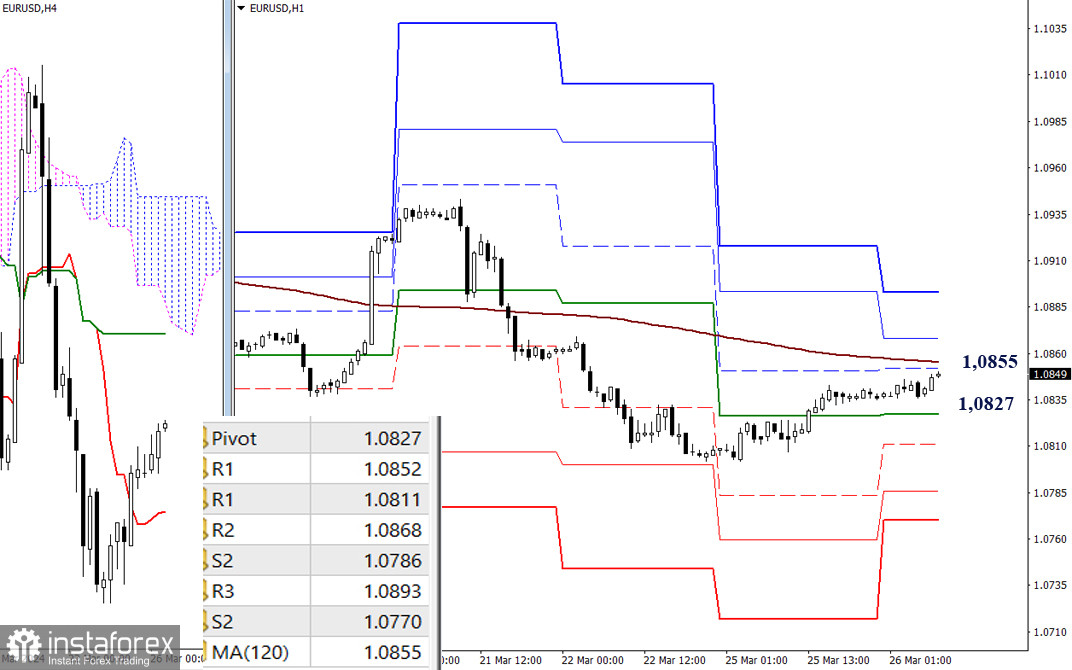
H4 - H1
On lower timeframes, the upward correction led to the pair approaching the key level—the weekly long-term trend (1.0855). This level determines the current balance of power. Trading below the level maintains the main advantage on the bears' side. If bearish players resume the decline today, then 1.0827 - 1.0811 - 1.0786 - 1.0770 (classic pivot points) will serve as supports for them. However, if the weekly long-term trend is breached and the pair manages to securely consolidate above, then further in the continuation of the ascent, the resistances of classic pivot points at 1.0868 - 1.0893 may serve as reference points within the day.
***
GBP/USD
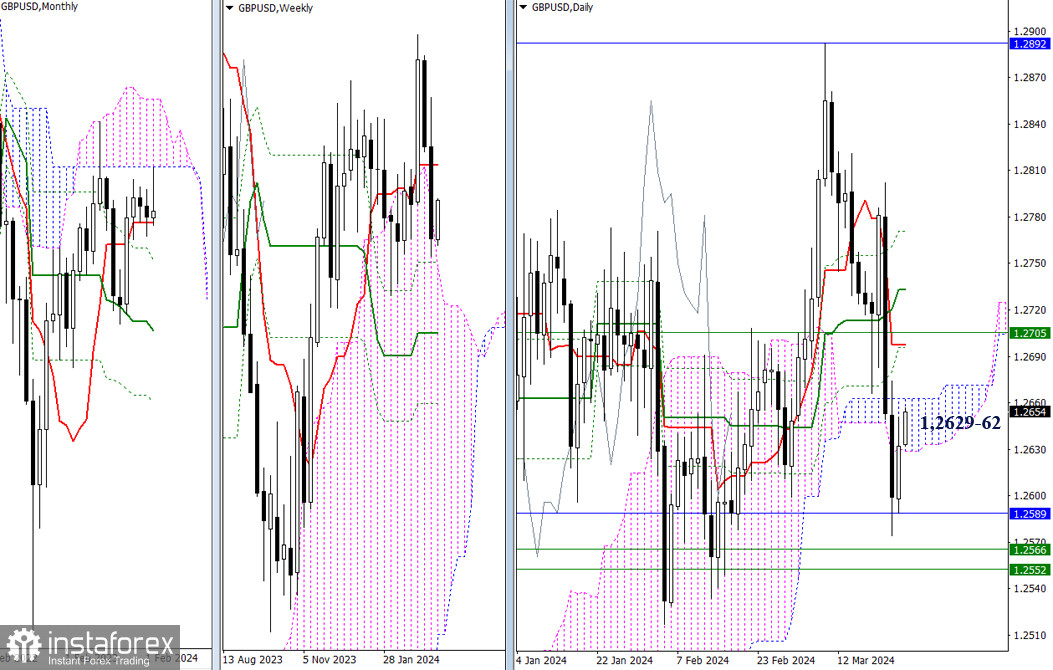
Higher timeframes
Bears failed to maintain their momentum; yesterday, the opponents seized the initiative. As a result, the pair returned to the daily cloud (1.2629-62). If bulls prevail in the current confrontation, plans for the liquidation of the death cross of the daily Ichimoku cloud will become relevant again; the levels of the cross can now be marked at the boundaries of 1.2698 - 1.2733 - 1.2771.
Currently, the strengthening is represented by the weekly short-term trend (1.2705). If bears regain their momentum in the market, they will have to start with a new attempt to test the support zone at 1.2589 - 1.2566 - 1.2582, which combines monthly and weekly levels.
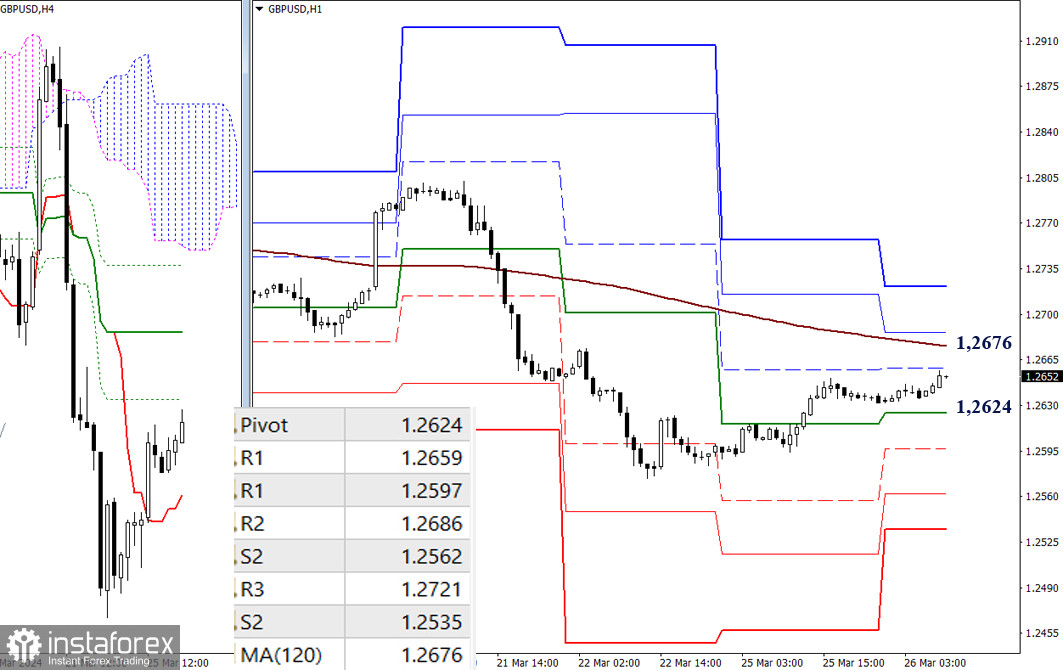
H4 - H1
On lower timeframes, a corrective rise is developing. Bulls are approaching the testing of the key level of lower timeframes, responsible for the current balance of power—1.2676 (weekly long-term trend). Possessing the level provides an initial advantage. In the course of movement, bulls today may utilize the resistances of classic pivot points (1.2686 - 1.2721). In the event of a decrease being realized, bears will act today through 1.2624 - 1.2597 - 1.2562 - 1.2535 (supports of classic pivot points).
***
The technical analysis of the situation uses:
Higher timeframes - Ichimoku Kinko Hyo (9.26.52) + Fibonacci Kijun levels
Lower timeframes - H1 - Pivot Points (classic) + Moving Average 120 (weekly long-term trend)