 English
  Русский
 Bahasa Indonesia
 Bahasa Malay
 ไทย
ไทย Español
 Deutsch
 Български
 Français
 Tiếng Việt
 中文
中文 বাংলা
বাংলা हिन्दी
 Čeština
 Українська
 Română

Analyzing Monday's trades:
EUR/USD on 1H chart
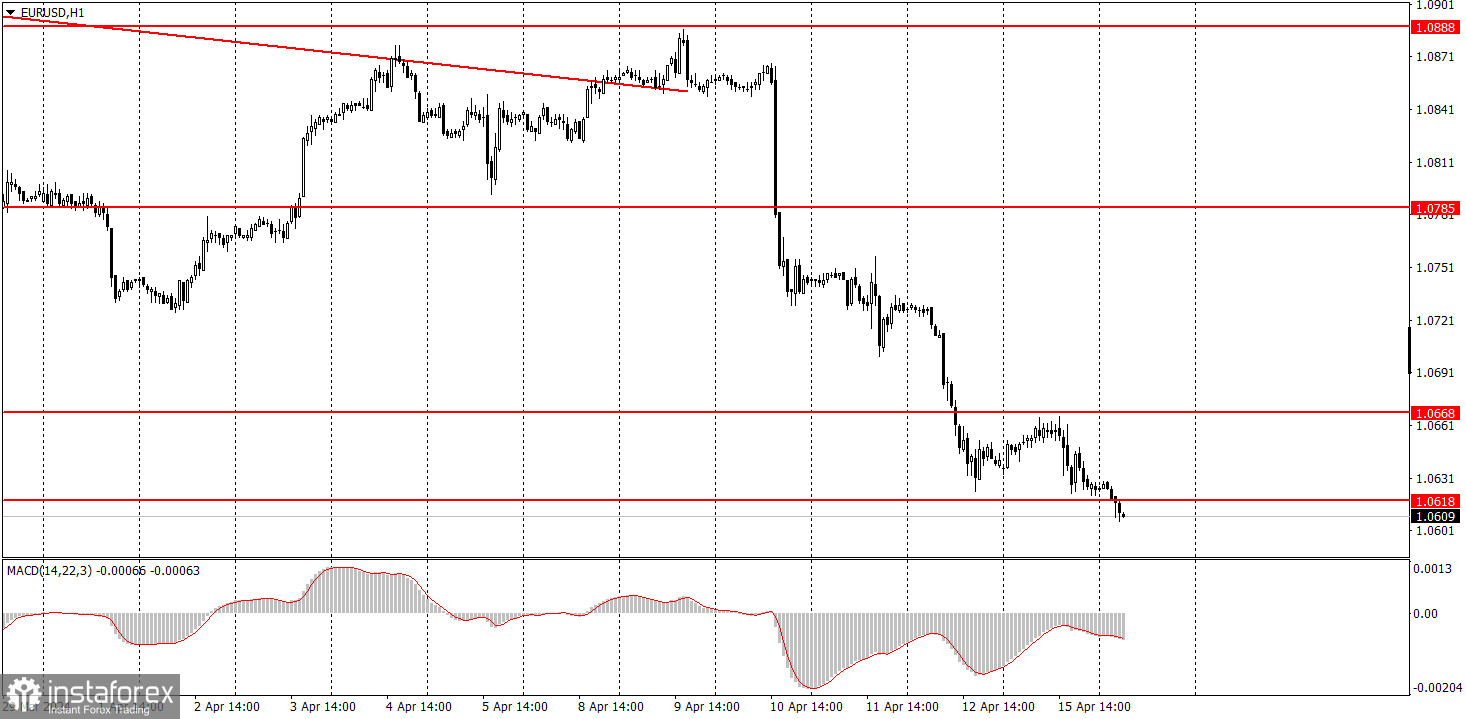
EUR/USD returned to its favorite style of movement over the past few months – low volatility. However, take note that the downtrend persists, the bullish correction after the three-day slump was quite weak, and by the end of the day, the euro depreciated even further. Thus, the market did not even pause after last week's decline and they started to sell the euro again on Monday.
In our opinion, the current movement is completely logical. We repeatedly mentioned that the euro has no grounds to rise at the moment. And after the US inflation report (which puts an end to market hopes of a Federal Reserve rate cut in June), the dollar has even more reasons to rise. At the same time, the European Central Bank may lower rates in June, as members of the bank's monetary committee are already openly speaking about this. Therefore, we expect the euro to fall further. Yesterday, the US retail sales report came in above expectations, so the dollar had macroeconomic support.
EUR/USD on 5M chart
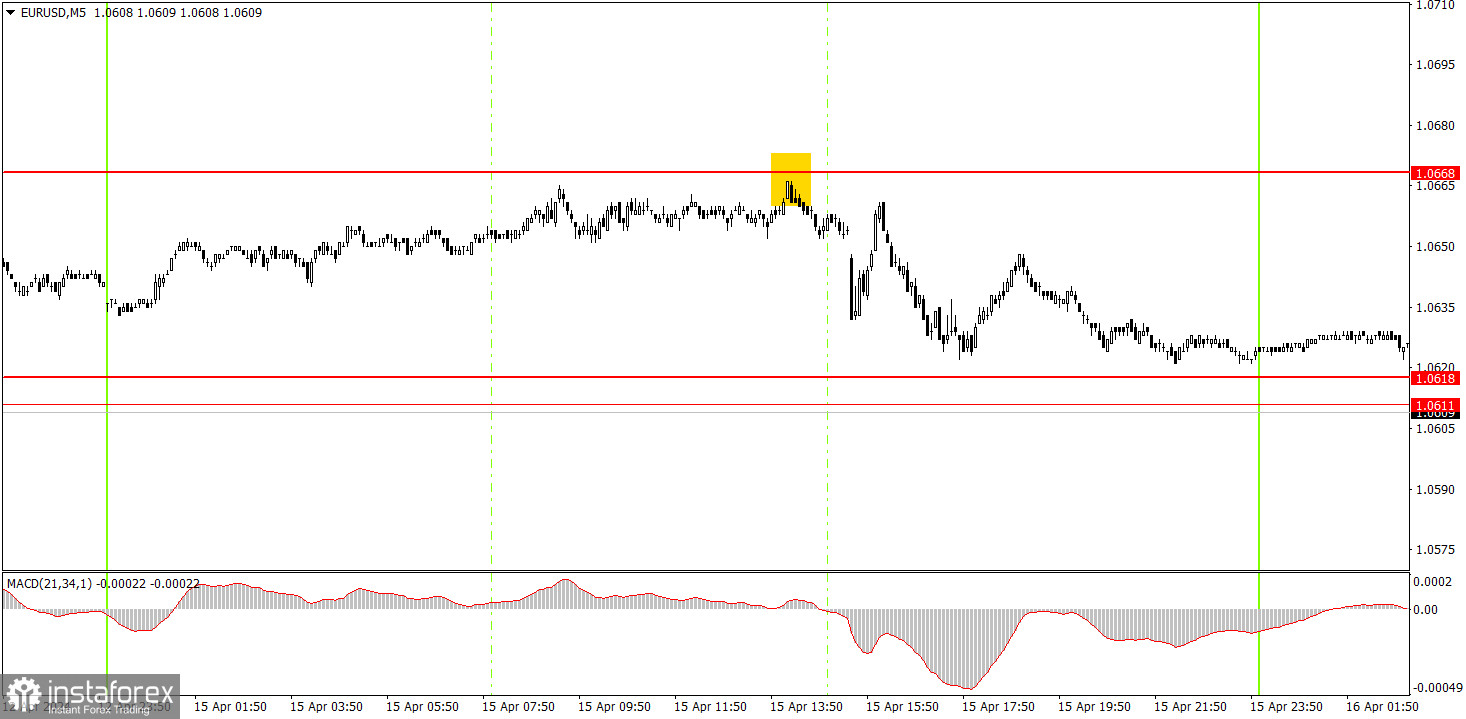
Only one trading signal was generated on the 5-minute timeframe. Before the opening of the US trading session, the pair rebounded from the level of 1.0668 with an error of 2 points, after which it managed to drop almost to the level of 1.0618. The pair did not reach this level, but the price remained near it for almost the entire evening. Therefore, beginners had enough time to manually close the short position. The profit from it was about 25 pips. With a total volatility of just over 40 pips, this is an excellent result.
Trading tips on Tuesday:
On the hourly chart, the downtrend persists. We believe that the euro should continue to fall regardless, as it is still too high, and in general, the trend is headed downwards. The recent macro data have provided full support for the US dollar. The fundamental background indicates that the ECB will start lowering rates at the next meeting, while the Fed's move remains uncertain.
Today, the pair may continue moving downwards. The pair has breached the level of 1.0618, and the bullish correction turned out to be a minor move. Therefore, beginners may consider short positions again, aiming for 1.0568.
The key levels on the 5M chart are 1.0483, 1.0526, 1.0568, 1.0611-1.0618, 1.0668, 1.0725, 1.0785-1.0797, 1.0838-1.0856, 1.0888-1.0896, 1.0940, 1.0971-1.0981. In the European Union, the economic sentiment indices from the ZEW Institute for the euro area may provide impetus to traders. In the United States, reports on building permits, housing starts, and industrial production will be released. We consider these as secondary reports and do not expect a strong market reaction to them.
Basic trading rules:
1) Signal strength is determined by the time taken for its formation (either a bounce or level breach). A shorter formation time indicates a stronger signal.
2) If two or more trades around a certain level are initiated based on false signals, subsequent signals from that level should be disregarded.
3) In a flat market, any currency pair can produce multiple false signals or none at all. In any case, the flat trend is not the best condition for trading.
4) Trading activities are confined between the onset of the European session and mid-way through the U.S. session, after which all open trades should be manually closed.
5) On the 30-minute timeframe, trades based on MACD signals are only advisable amidst substantial volatility and an established trend, confirmed either by a trendline or trend channel.
6) If two levels lie closely together (ranging from 5 to 15 pips apart), they should be considered as a support or resistance zone.
How to read charts:
Support and Resistance price levels can serve as targets when buying or selling. You can place Take Profit levels near them.
Red lines represent channels or trend lines, depicting the current market trend and indicating the preferable trading direction.
The MACD(14,22,3) indicator, encompassing both the histogram and signal line, acts as an auxiliary tool and can also be used as a signal source.
Significant speeches and reports (always noted in the news calendar) can profoundly influence the price dynamics. Hence, trading during their release calls for heightened caution. It may be reasonable to exit the market to prevent abrupt price reversals against the prevailing trend.
Beginning traders should always remember that not every trade will yield profit. Establishing a clear strategy coupled with sound money management is the cornerstone of sustained trading success.