 English
  Русский
 Bahasa Indonesia
 Bahasa Malay
 ไทย
ไทย Español
 Deutsch
 Български
 Français
 Tiếng Việt
 中文
中文 বাংলা
বাংলা हिन्दी
 Čeština
 Українська
 Română

EUR/USD
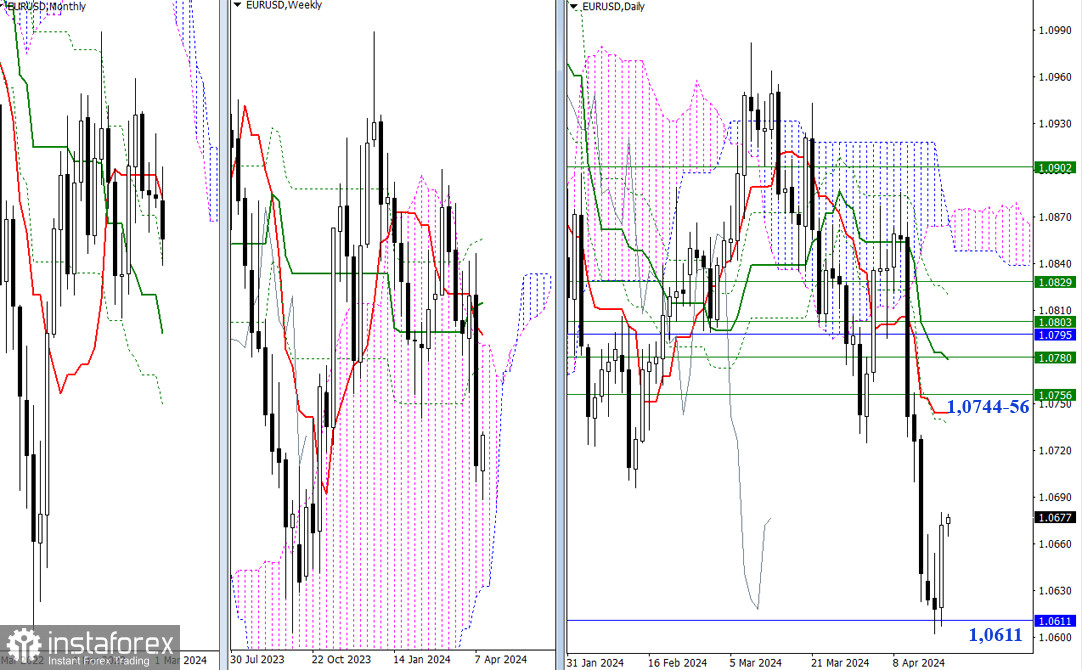
Higher Timeframes
The monthly boundary of 1.0611 is still the most important obstacle for developing bearish bias on this section of the chart. Yesterday, in the process of testing the monthly support (1.0611), the daily rebound was executed. Confirming and developing the rebound will direct the corrective rise to the target levels, which are now represented by the resistance levels of the higher time frames. The nearest important resistances can be found at 1.0744 (daily short-term trend) and 1.0756 (weekly Fibo Kijun).
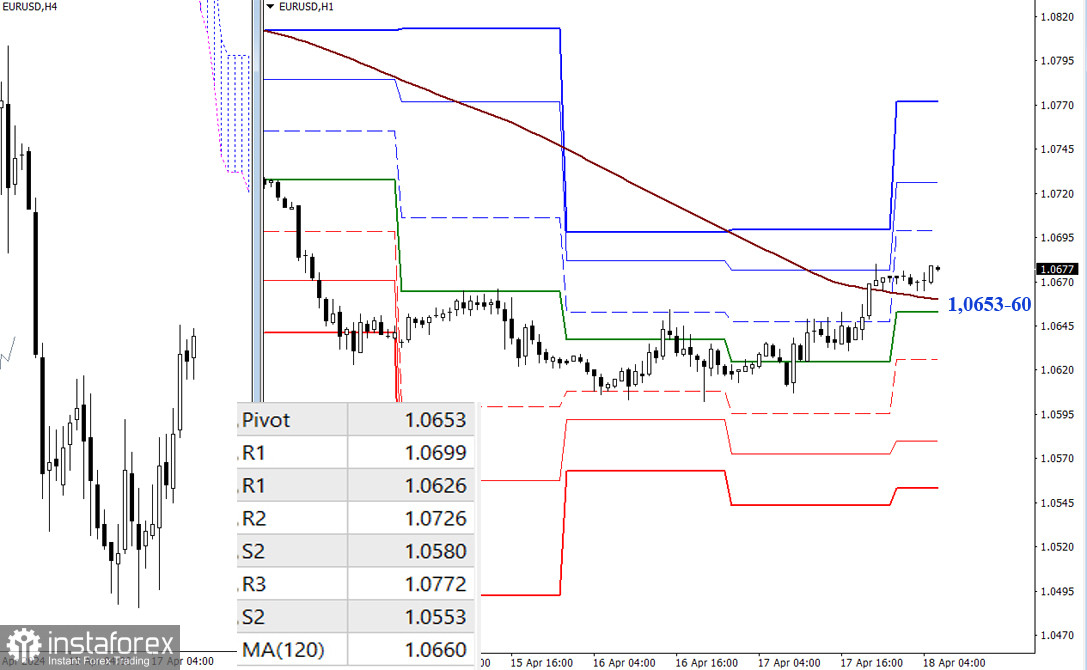
H4 – H1
During the daily rebound, the bulls managed to rise above the key levels of the lower time frames, so they had a major advantage on the lower time frames. The rebound will strengthen the bullish bias. Resistance of classic Pivot points (1.0699 - 1.0726 - 1.0772) will serve as reference points for the intraday rise. The loss of key levels at 1.0653-60 (central Pivot level + weekly long-term trend) may return the bearish bias, whose focus for the day will be on the support of classic Pivot points (1.0626 - 1.0580 - 1.0553).
***
GBP/USD
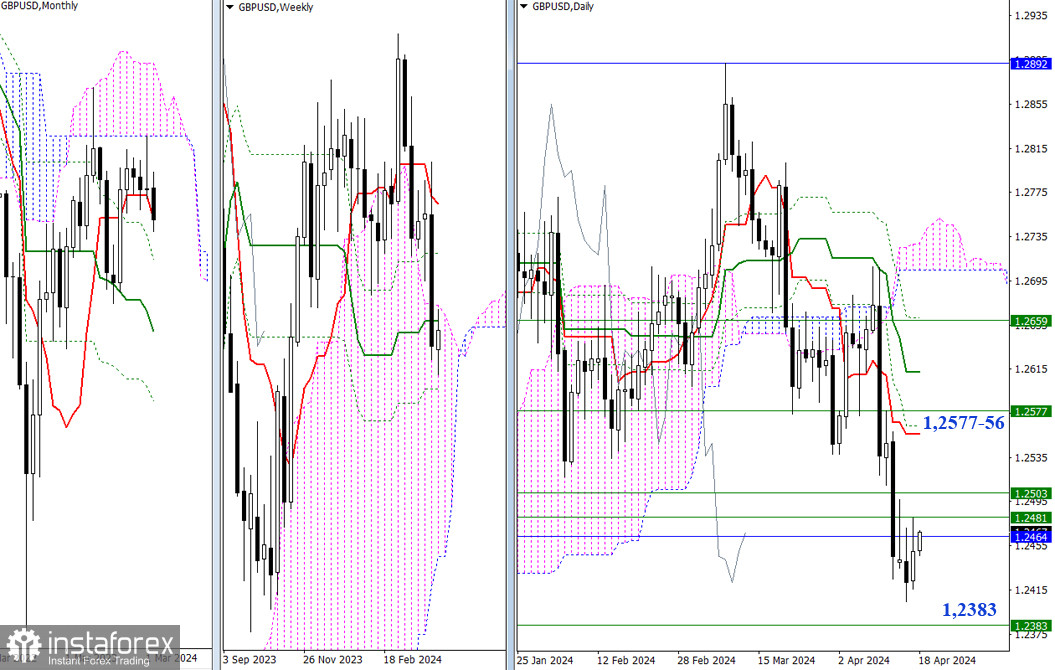
Higher Timeframes
Daily consolidation continues to unfold. The levels at 1.2464 - 1.2481 (monthly short-term trend + weekly medium-term trend) are still being tested. A rise above the current resistance area of 1.2464-81 - 1.2503 could provide a solid basis for strengthening the bullish bias and may also support the pair with the upward correction. Additional prospects can be found at 1.2556 - 1.2577 (for the bulls) and at 1.2383 (for the bears).
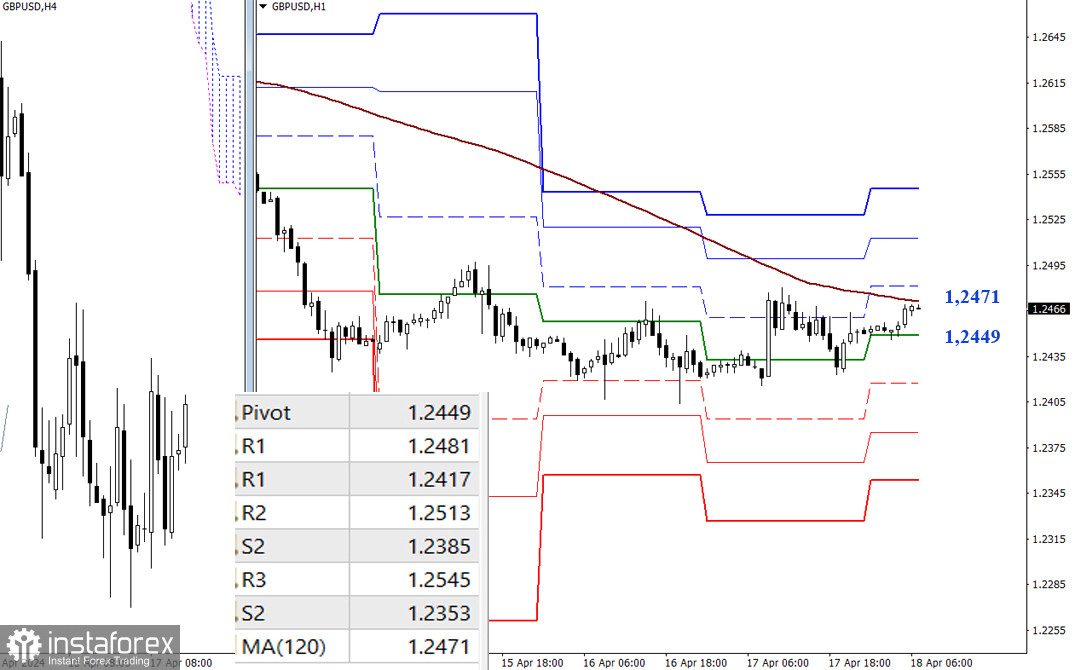
H4 – H1
The bullish correction led the pair to test the key level of the lower timeframe - the weekly long-term trend (1.2471). The bulls can gain a main advantage using a breakout and reversal from this level. Resistance of classic Pivot points (1.2481 - 1.2513 - 1.2545) will become the reference points. A pullback from the weekly long-term trend will bring back bearish prospects, with support of the classic Pivot points (1.2417 - 1.2385 - 1.2353) serving as benchmarks for the intraday decline.
***
The technical analysis of the situation uses:
Higher timeframes - Ichimoku Kinko Hyo (9.26.52) + Fibonacci Kijun levels
Lower timeframes - H1 - Pivot Points (classic) + Moving Average 120 (weekly long-term trend)