English
  Русский
 Bahasa Indonesia
 Bahasa Malay
 ไทย
ไทย Español
 Deutsch
 Български
 Français
 Tiếng Việt
 中文
中文 বাংলা
বাংলা हिन्दी
 Čeština
 Українська
 Română

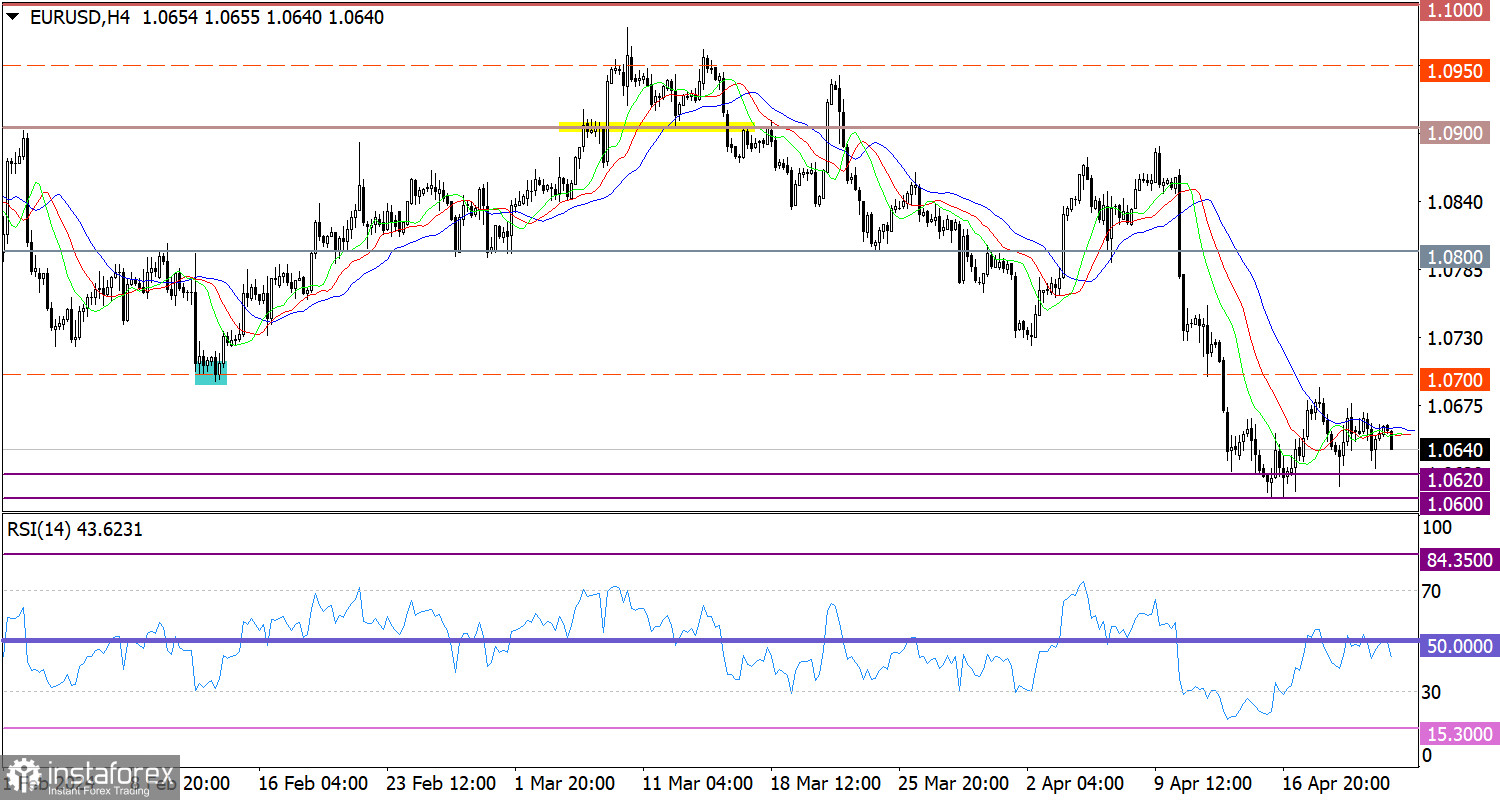
The EUR/USD pair is moving around the base of the downward cycle, where a sideways range has formed. The support level is at 1.0600, while the peak of this sideways range may reach the value of 1.0700.
On the 4-hour chart, the RSI hovered along the 50 mid line, indicating uncertainty among market participants.
On the same time frame, the Alligator's MAs are intersecting each other, which points to a stagnant phase.
Outlook
In this situation, we can see a slowdown in the downward cycle, which resulted in a stagnant phase within the 1.0600/1.0700 range. In order for EUR/USD to leave this range, the price must settle beyond one of the levels. In terms of technical analysis, this could strengthen trading positions in the direction of a breakout.
Complex indicator analysis indicates a flat phase in the short- and long-term timeframes.