 English
  Русский
 Bahasa Indonesia
 Bahasa Malay
 ไทย
ไทย Español
 Deutsch
 Български
 Français
 Tiếng Việt
 中文
中文 বাংলা
বাংলা हिन्दी
 Čeština
 Українська
 Română

EUR/USD
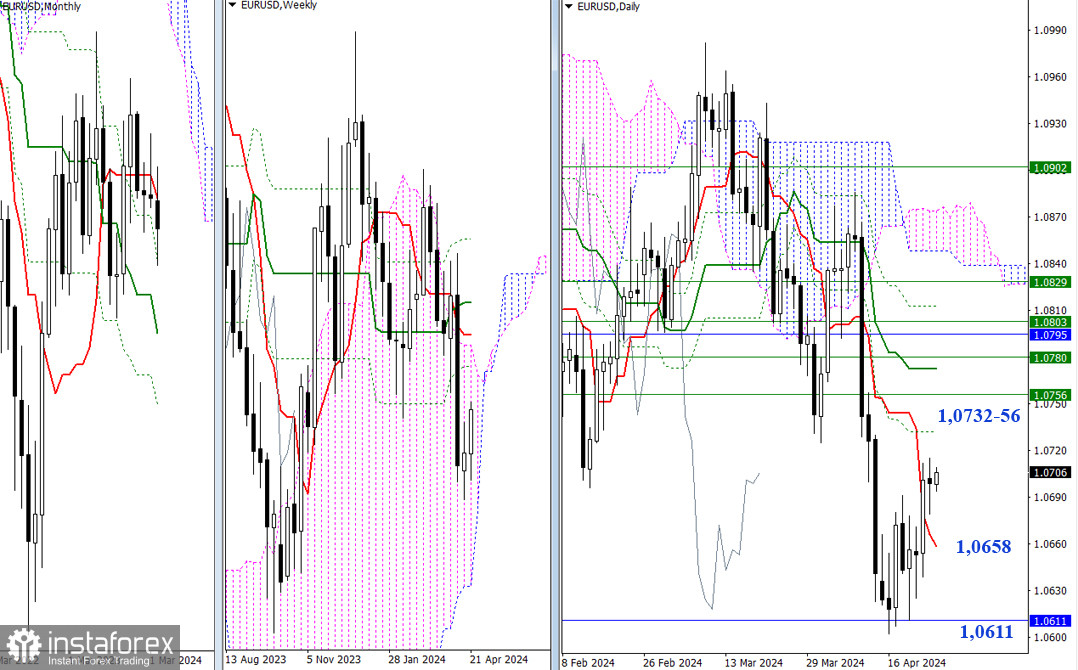
Higher Timeframes
Yesterday, volume and volatility remained low. Nevertheless, the market maintained its position above the daily short-term trend. As a result, the main conclusions and expectations remain unchanged. For bulls, the nearest resistances around 1.0732-56 (daily and weekly Fibonacci Kijun levels) may still serve as reference points, while bears can look to the daily short-term trend (1.0658) and the monthly Fibonacci Kijun (1.0611).
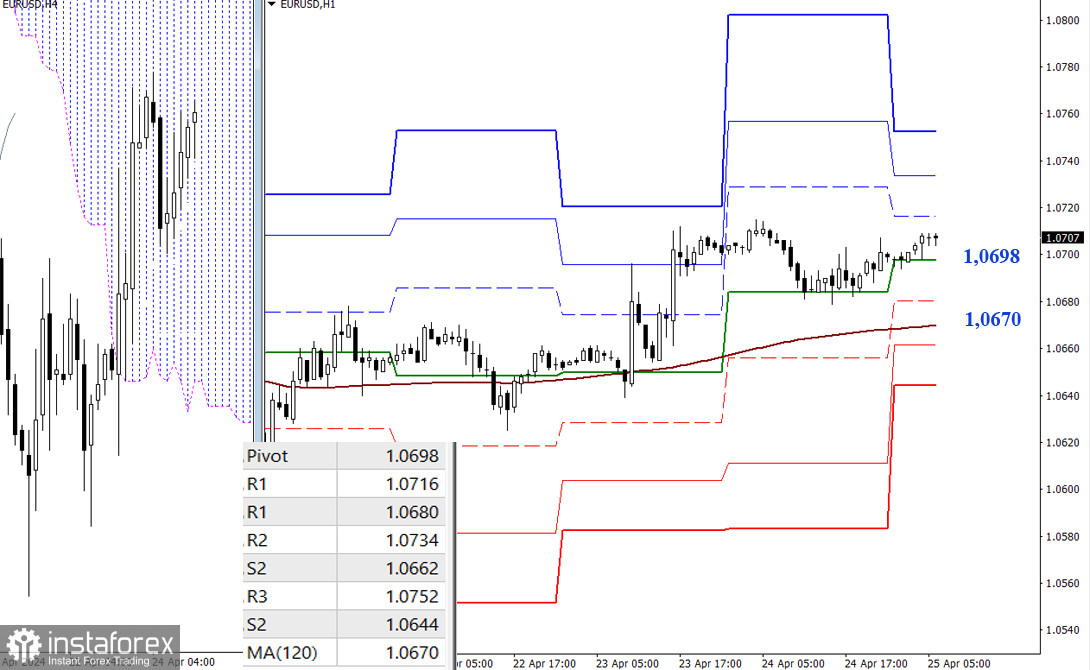
H4 – H1
On the lower timeframes, the pair is still going through a correction. In case the price breaks out of it, which requires testing yesterday's high (1.0715), resistance to bullish movement may come from the classical Pivot levels R1 (1.0716) - R2 (1.0734) - R3 (1.0752). As the pair continues to go through a correction, key levels gain importance - the central Pivot level (1.0698) and the weekly long-term trend (1.0670). A breakout and a trend reversal will change the current balance of power and strengthen the bears. Today, additional intraday supports can be found at 1.0662 - 1.0644 (classic Pivot levels).
***
GBP/USD
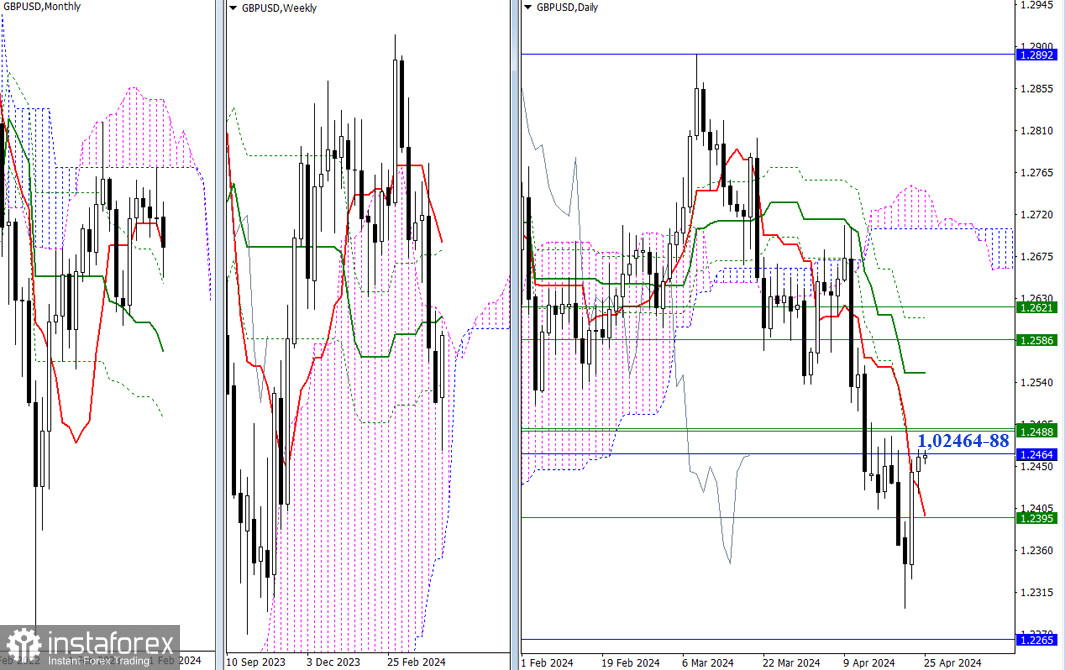
Higher Timeframes
The bullish correction brought the pair to test the nearest resistance area, which combines monthly and weekly levels (1.2464-88). The outcome will determine possible scenarios. In the event of a breakthrough, the bulls will have new prospects, while in case of a rebound, the focus will return to the area around 1.2395 (the final level of the weekly Ichimoku cross + the daily short-term trend).
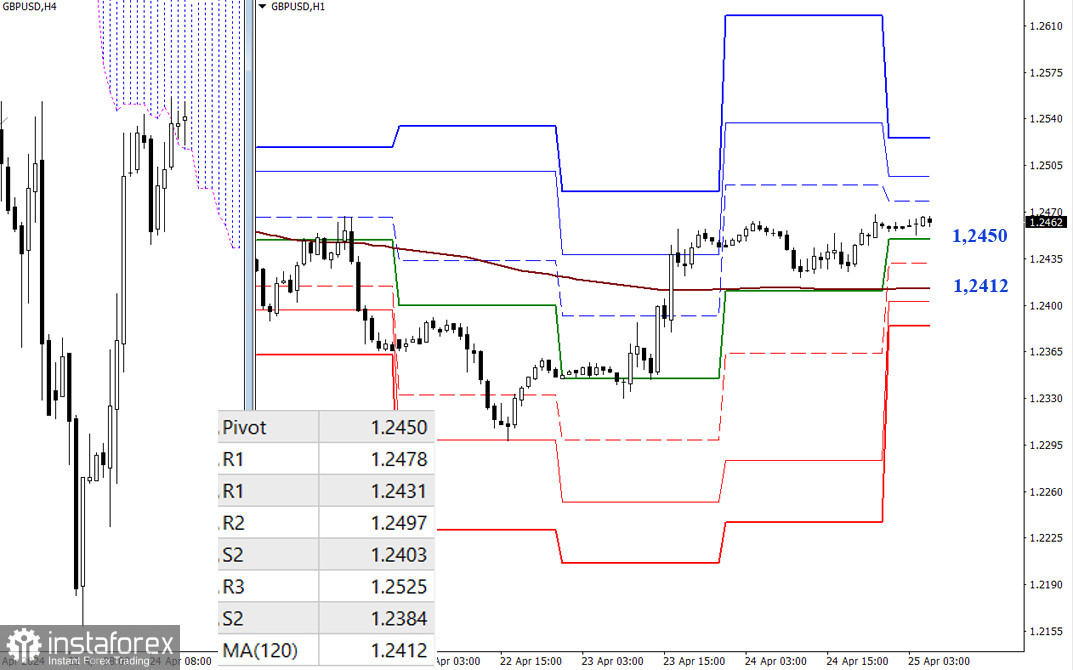
H4 – H1
The pair has updated the previous high and continues to strive for further upward movement. On the lower timeframes, the classic Pivot levels serve as reference points for continuing the ascent (1.2478 - 1.2497 - 1.2525). If the opponent grabs the initiative, then today, corrective targets can be found at 1.2450 (the central Pivot level of the day) and 1.2412 (the weekly long-term trend). Further intraday support levels may come from the classical Pivot levels S2 (1.2403) and S3 (1.2384).
***
The technical analysis of the situation uses:
Higher timeframes - Ichimoku Kinko Hyo (9.26.52) + Fibonacci Kijun levels
Lower timeframes - H1 - Pivot Points (classic) + Moving Average 120 (weekly long-term trend)