 English
  Русский
 Bahasa Indonesia
 Bahasa Malay
 ไทย
ไทย Español
 Deutsch
 Български
 Français
 Tiếng Việt
 中文
中文 বাংলা
বাংলা हिन्दी
 Čeština
 Українська
 Română

Analysis of GBP/USD 5M
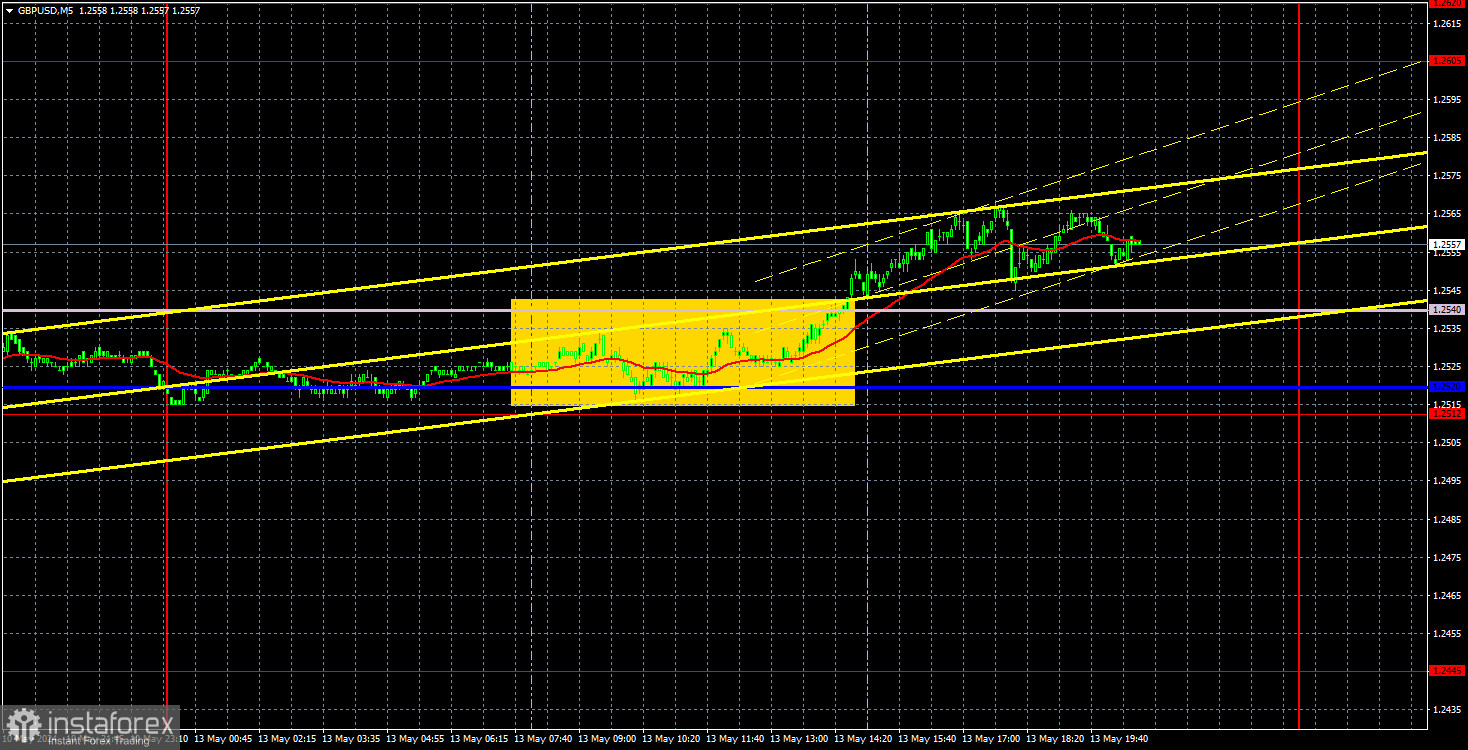
Yesterday, the GBP/USD pair gradually moved higher after bouncing off the 1.2445 level, which can be considered the lower boundary of the new sideways channel. As we previously mentioned, the Ichimoku indicator lines are weak in a flat market, just like the current movements of the GBP/USD pair. No matter how you look at it, it is very difficult to trade right now and sometimes it even seems impractical. The pound is trading sluggishly, illogically, and now it is in a flat as well.
There were no important reports on Monday, so traders had nothing to react to. Nevertheless, the pound rose by a couple of dozen pips, although there were no grounds for this. However, it had reasons to rise on Friday, when reports on UK GDP and industrial production exceeded forecasts, and the US consumer sentiment index from the University of Michigan fell short. But the pound didn't rise on that day. Instead, we saw a flat. However, the pound can no longer surprise us.
Technically, a buy signal was formed on Monday. The pair spent the entire European trading session between the Kijun-sen and Senkou Span B lines, and it only managed to consolidate above them at the beginning of the US session. These lines could be considered as an area since the distance between them was only 20 pips. After consolidating above this area, the price managed to rise by at most 20 pips, and the total volatility for the day was 53 pips. However, the trade could have been closed with profit since it should have been closed manually.
COT report:
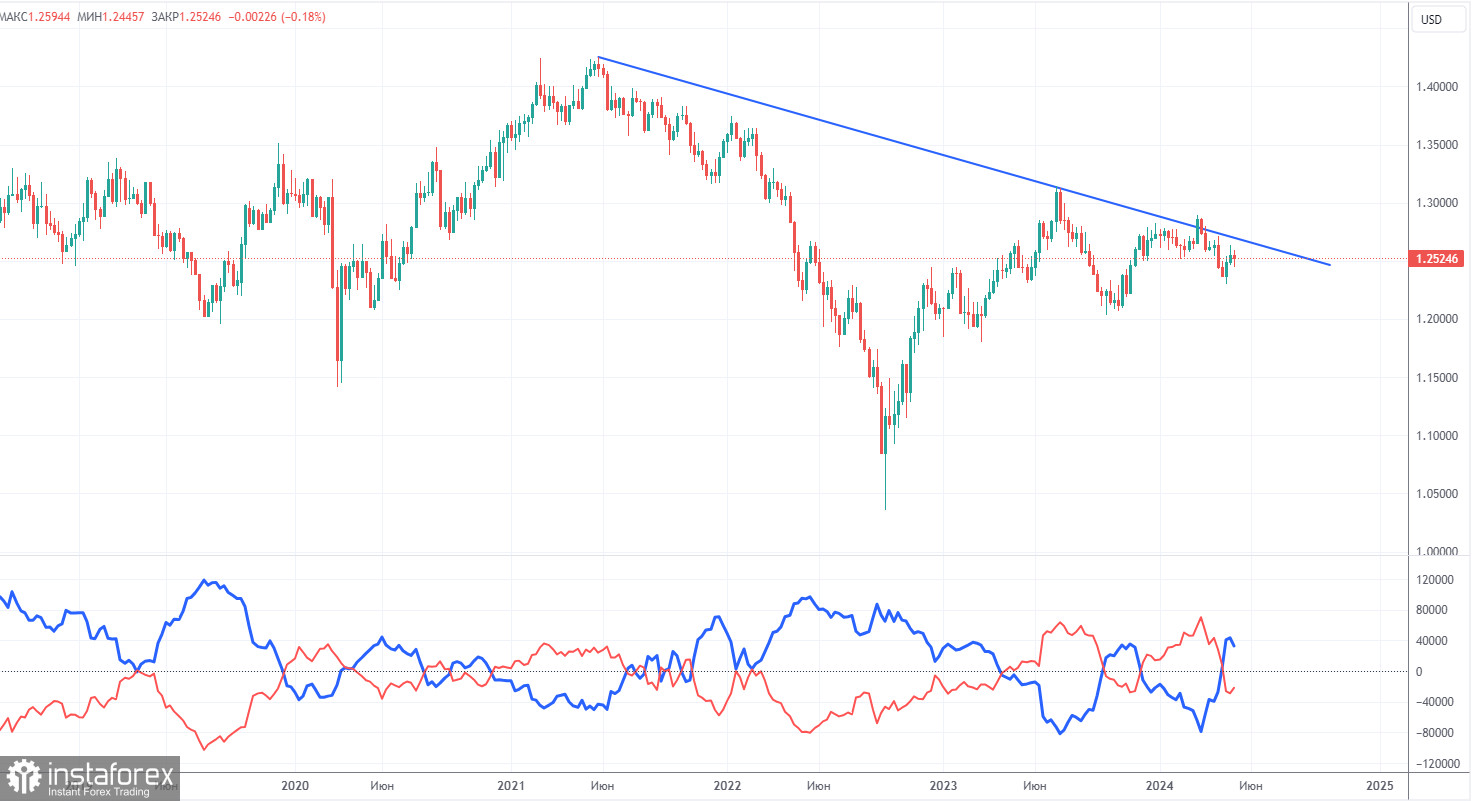
COT reports on the British pound show that the sentiment of commercial traders often changes in recent years. The red and blue lines, which represent the net positions of commercial and non-commercial traders, constantly intersect and, in most cases, remain close to the zero mark. According to the latest report on the British pound, the non-commercial group opened 8,100 buy contracts and 900 short ones. As a result, the net position of non-commercial traders increased by 7,200 contracts in a week. Sellers continue to hold their ground, but they have a small advantage. The fundamental background still does not provide a basis for long-term purchases of the pound sterling, and the currency finally has a real chance to resume the global downward trend. The trend line on the 24-hour TF clearly shows this. Almost all of the factors point to the pound's decline.
The non-commercial group currently has a total of 51,800 buy contracts and 73,600 sell contracts. Now the bears are in control and the pound has a huge potential to fall. We can only hope that inflation in the UK does not accelerate, or that the Bank of England will not intervene.
Analysis of GBP/USD 1H
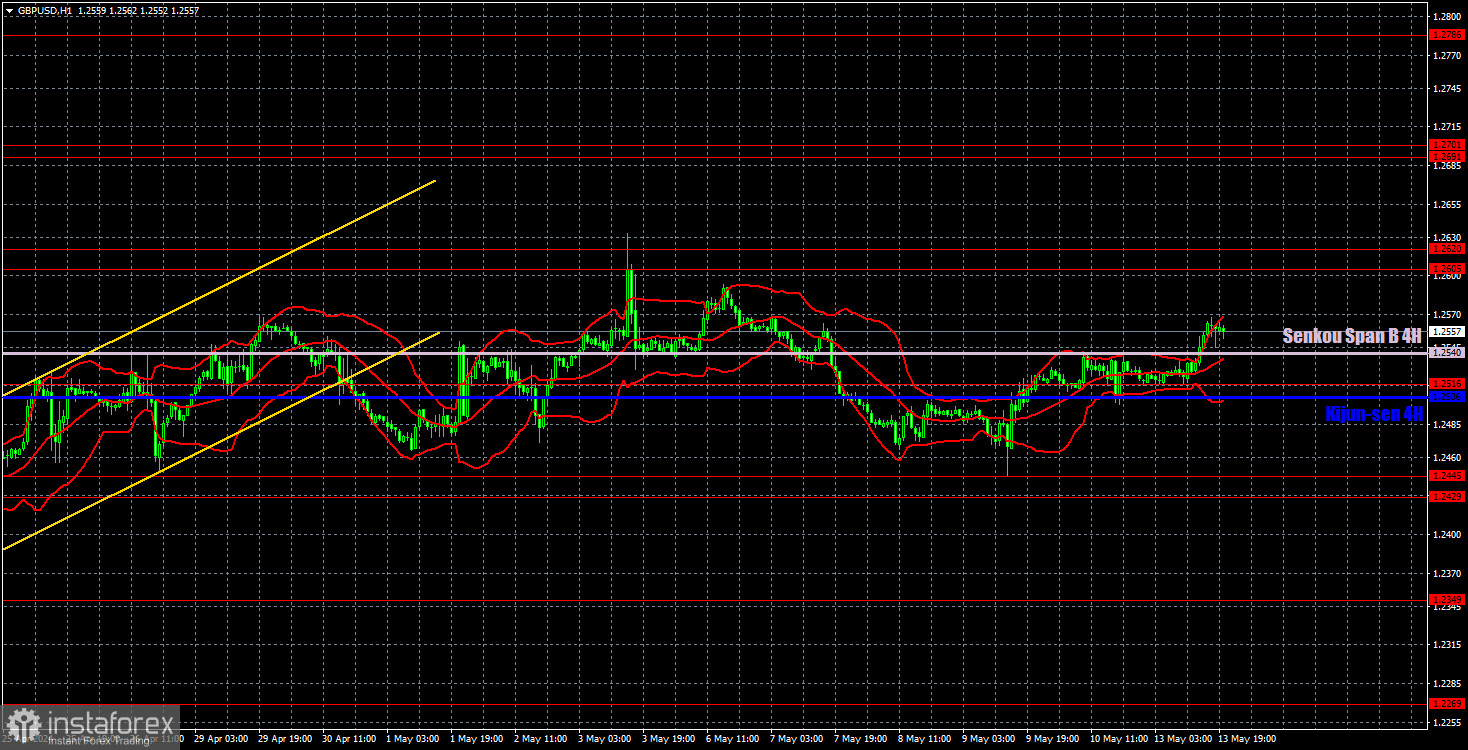
On the 1H chart, GBP/USD continues to go through a bullish correction, which could turn into anything. Since the price could not overcome the area of 1.2605-1.2620, there are hopes of bringing back the downward trend in the medium-term. However, the pound has been trading in a new sideways channel for over a week now. It's hard to imagine how much more time it will spend in the next flat.
As of May 14, we highlight the following important levels: 1.2215, 1.2269, 1.2349, 1.2429-1.2445, 1.2516, 1.2605-1.2620, 1.2691-1.2701, 1.2786, 1.2863, 1.2981-1.2987. The Senkou Span B line (1.2540) and Kijun-sen (1.2506) lines can also serve as sources of signals. Don't forget to set a Stop Loss to breakeven if the price has moved in the intended direction by 20 pips. The Ichimoku indicator lines may move during the day, so this should be taken into account when determining trading signals.
There will be interesting events on Tuesday. The UK will release relatively important reports on unemployment, unemployment claims, and wages. Not that we expect a strong reaction to these reports, but volatility may gradually increase. In America, Federal Reserve Chairman Jerome Powell will speak, which is always important and interesting, and the Producer Price Index will also be published. Actually, the market is not particularly eager to trade right now, so we don't expect mega-high volatility. Unless Powell reveals surprising information.
Description of the chart:
Support and resistance levels are thick red lines near which the trend may end. They do not provide trading signals;
The Kijun-sen and Senkou Span B lines are the lines of the Ichimoku indicator, plotted to the 1H timeframe from the 4H one. They provide trading signals;
Extreme levels are thin red lines from which the price bounced earlier. They provide trading signals;
Yellow lines are trend lines, trend channels, and any other technical patterns;
Indicator 1 on the COT charts is the net position size for each category of traders;