USD/JPY
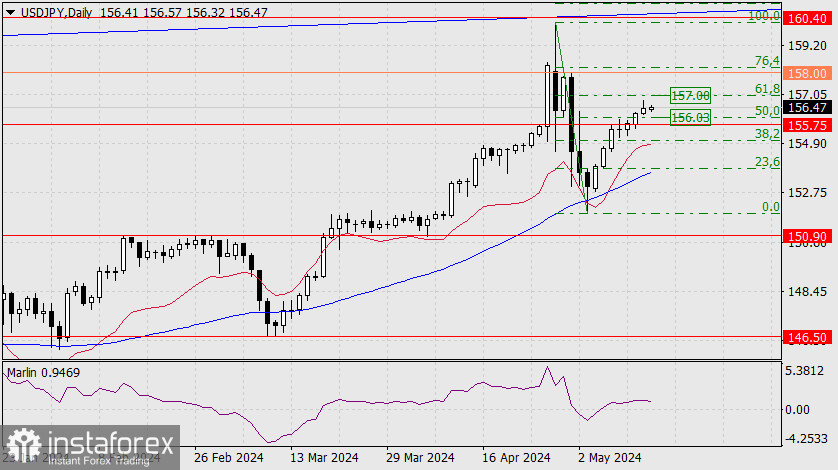
The USD/JPY pair is entering a complex period of consolidation. On the daily timeframe, it is within the Fibonacci range of 50.0-61.8%. The target support at 155.75 is below this range.

If the price consolidates below this level, it could move towards the 23.6% Fibonacci level, which is approaching the MACD line. However, as long as the signal line of the Marlin oscillator moves sideways, a story similar to the period from March 20 to April 9 may continue. The only difference is that back then the consolidation led to a sharp rise, whereas this time it might result in a sharp decline.

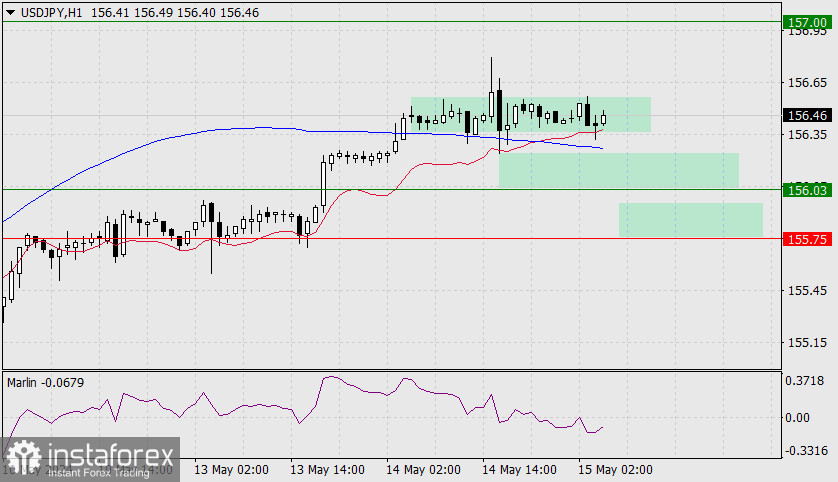
On the hourly chart, the price is consolidating above the balance and MACD indicator lines. The MACD line is declining and entering the lower range at the 50.0% Fibonacci level on the daily chart. Below this range, there could be a third support level at 155.75 for the period from May 10 to May 13. The Marlin oscillator is in the bearish territory, indicating a 60% probability that the price will fall.
 English
 Русский
 Bahasa Indonesia
 Bahasa Malay
 ไทย
ไทย Español
 Deutsch
 Български
 Français
 Tiếng Việt
 中文
中文 বাংলা
বাংলা हिन्दी
 Čeština
 Українська
 Română

