 English
  Русский
 Bahasa Indonesia
 Bahasa Malay
 ไทย
ไทย Español
 Deutsch
 Български
 Français
 Tiếng Việt
 中文
中文 বাংলা
বাংলা हिन्दी
 Čeština
 Українська
 Română

On the weekly chart, the price has broken through the support of the MACD line (blue moving average), while the Marlin oscillator has entered bearish territory.
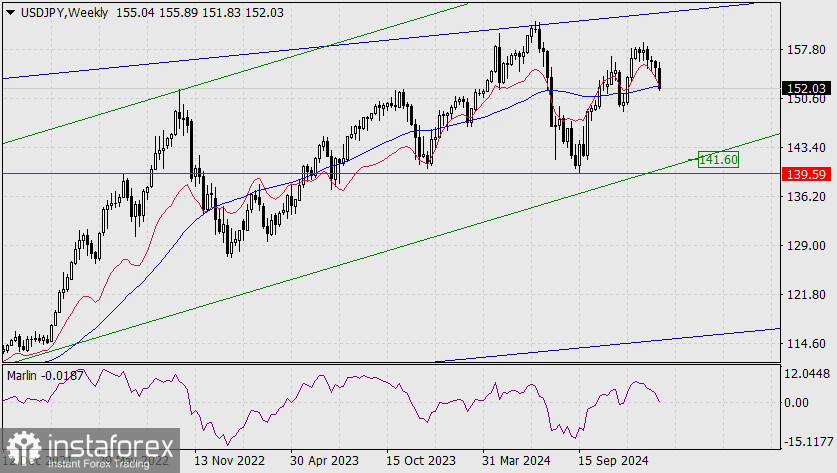
This suggests a potential medium-term decline toward the lower boundary of the green price channel, or, if it breaks through, toward the support level at 139.59.
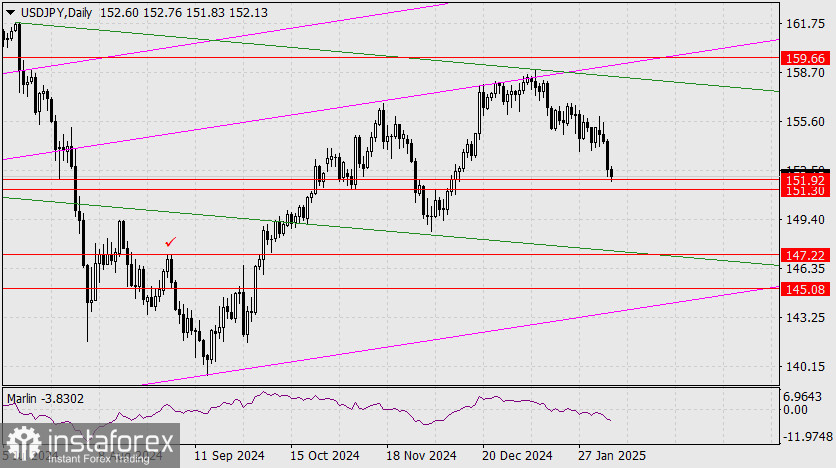
On the compressed daily chart, the price has reached the target range of 151.30 to 151.92. The Marlin oscillator is diving further into negative territory. If the price breaks below the lower boundary of this range, it will pave the way toward the next target at 147.22.
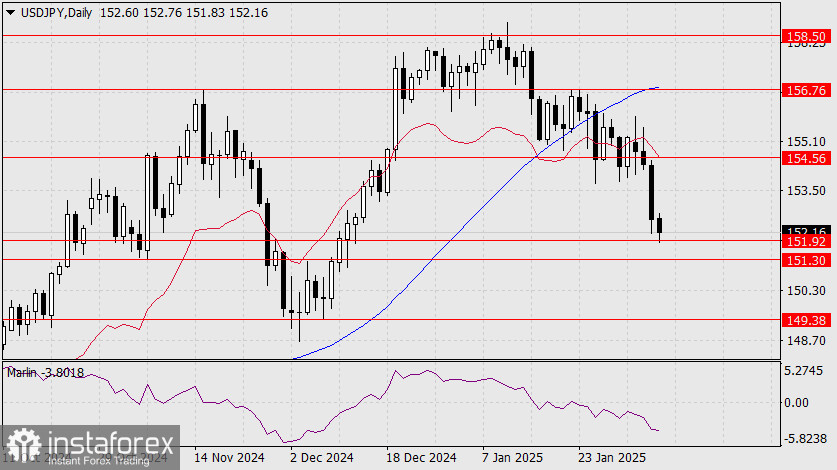
In a separate daily chart analysis, the price is pushing through the upper boundary of the 151.30 to 151.92 range, aiming to confirm a move toward the lower boundary and clear the path to the first target at 149.38, which is the peak from August 15, 2024.
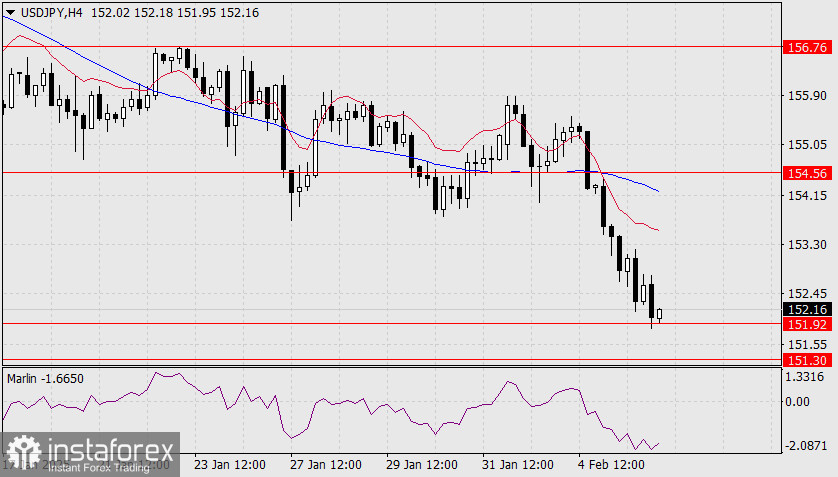
On the four-hour timeframe, the Marlin oscillator is showing a slight upward turn, indicating a potential minor correction or price consolidation above the current level, which could build momentum for further declines.