 English
 Русский
 Bahasa Indonesia
 Bahasa Malay
 ไทย
ไทย Español
 Deutsch
 Български
 Français
 Tiếng Việt
 中文
中文 বাংলা
বাংলা हिन्दी
 Čeština
 Українська
 Română


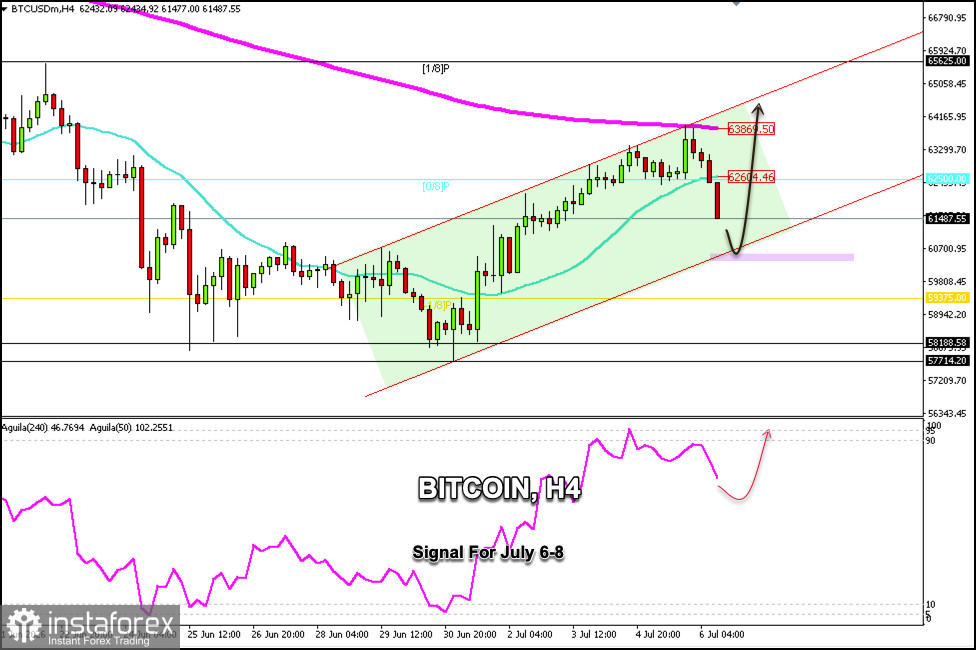
Bitcoin is trading around $61,487, after undergoing a sharp technical correction following its rise to the 200-day EMA around $63,870.
Since Bitcoin is consolidating below the Murray 0/8 line and the 21-period simple moving average (SMA), and is also trading below the 200-period exponential moving average (EMA), it could face downward pressure in the coming days and retest the June 30 low of around $57,700.
On the H4 chart, we can see that Bitcoin has been trading within a bullish channel that has been forming since early July. This has led it to reach the upper band of the bullish channel, which also coincided with the 200-period exponential moving average (EMA)—a strong resistance level. From that area, the price failed to break above $64,000, triggering a sharp decline.
Bitcoin could find strong support around the lower band of the uptrend channel, at $60,400; this area could be considered a good point to open long positions and expect it to reach $62,500 in the coming days; it could even reach the Murray 1/8 level, around $65,625.
A sharp break below the psychological $60,000 level could push Bitcoin down to $57,000. The price could even reach the Murray -2/8 level, around $55,000.
The Eagle indicator reached overbought levels on July 4, and the sharp decline technically pointed to a correction. Therefore, following this downward move, BTC could resume its uptrend as long as the price consolidates above the psychological level of $60,000.