 English
 Русский
 Bahasa Indonesia
 Bahasa Malay
 ไทย
ไทย Español
 Deutsch
 Български
 Français
 Tiếng Việt
 中文
中文 বাংলা
বাংলা हिन्दी
 Čeština
 Українська
 Română


The 1-hour (H1) chart for Crude Oil reveals pivotal price movements reflecting a tug-of-war between buying and selling forces; the price is currently trading near the $102.21 level after successfully breaking free from recent bearish pressure.
Technical Reading and Price Action
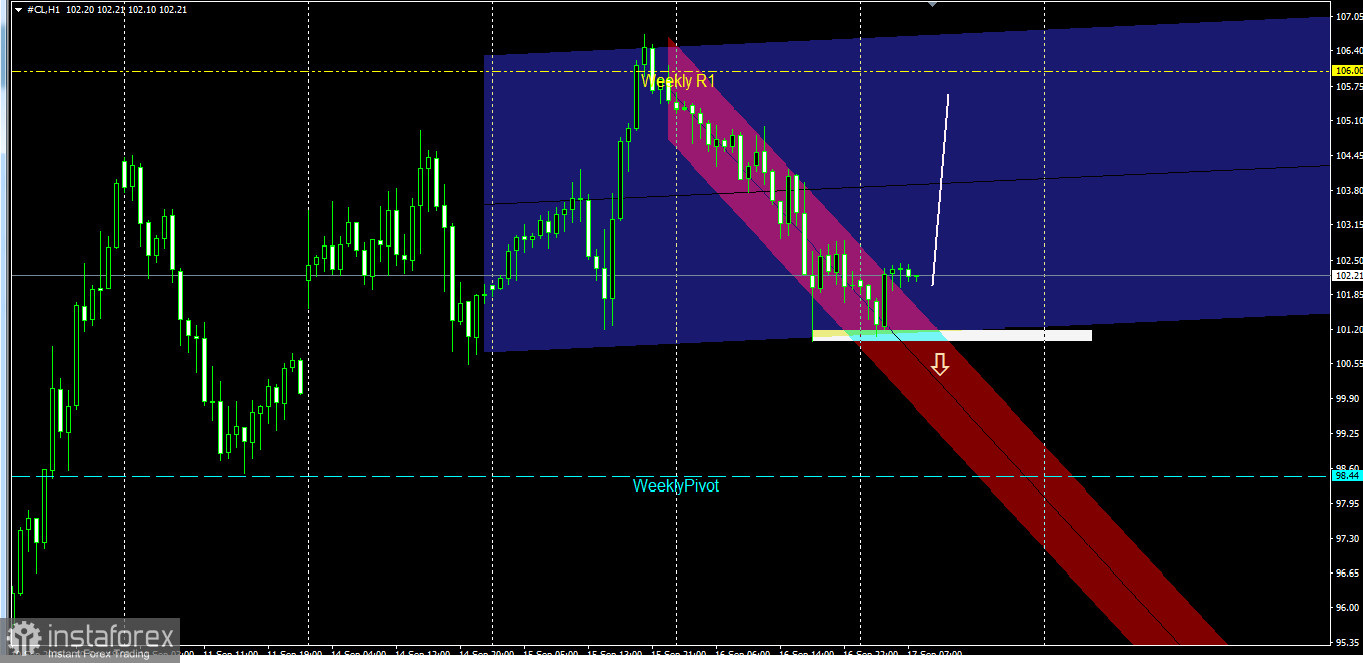
Price Channel Structure: Today's session opened within the range of two overlapping channels: the blue channel (horizontal/sideways), representing price movement over the past two days, and the red channel (bearish), representing the corrective downward wave of the previous session.
Rebound from the Lower Support Line: Early hours saw a test of the blue channel's lower boundary, from which the price rebounded strongly—bolstered by clear buying support—thereby halting the decline.
Breakout from the Bearish Channel: The price managed to break above the upper boundary of the red bearish channel and stabilize within the blue channel's range, reinforcing expectations of a shift toward bullish momentum.
Trading Recommendations and Expected Scenarios
Based on current chart data, there are two primary outlooks for oil's movement in the coming hours:
Bullish Scenario (Primary): Establishing a base above the broken red channel and stabilizing above $101.85 Targeting $106.00 (the upper boundary of the blue channel and the Weekly R1 resistance level) This scenario is invalidated if the blue channel is breached and the price drops below $101.20. Bearish Scenario (Alternative): A break below the lower boundary of the blue channel and the $101.20 support level, targeting $98.44 (Weekly Pivot level). This scenario is invalidated if trading resumes above the $102.50 level.
Trading Plan and Risk Management
Buy Setup: A favorable buying opportunity exists at current levels (102.00 – 102.30) or upon a minor retest of the 101.85 area, targeting 104.45 followed by 106.00.
Risk Management: It is recommended to place a stop-loss order below the recent pivotal low and the support level at $101.10, while maintaining a balanced risk ratio to preserve capital.
The daily chart for crude oil (#CL, Daily) shows a clear continuation of strong bullish momentum; the price is currently trading near the $101.81 level following a rebound and a recent test of the lower boundary of the inner ascending channel, reinforcing the dominance of buying pressure on price action.
Technical Analysis and Price Action
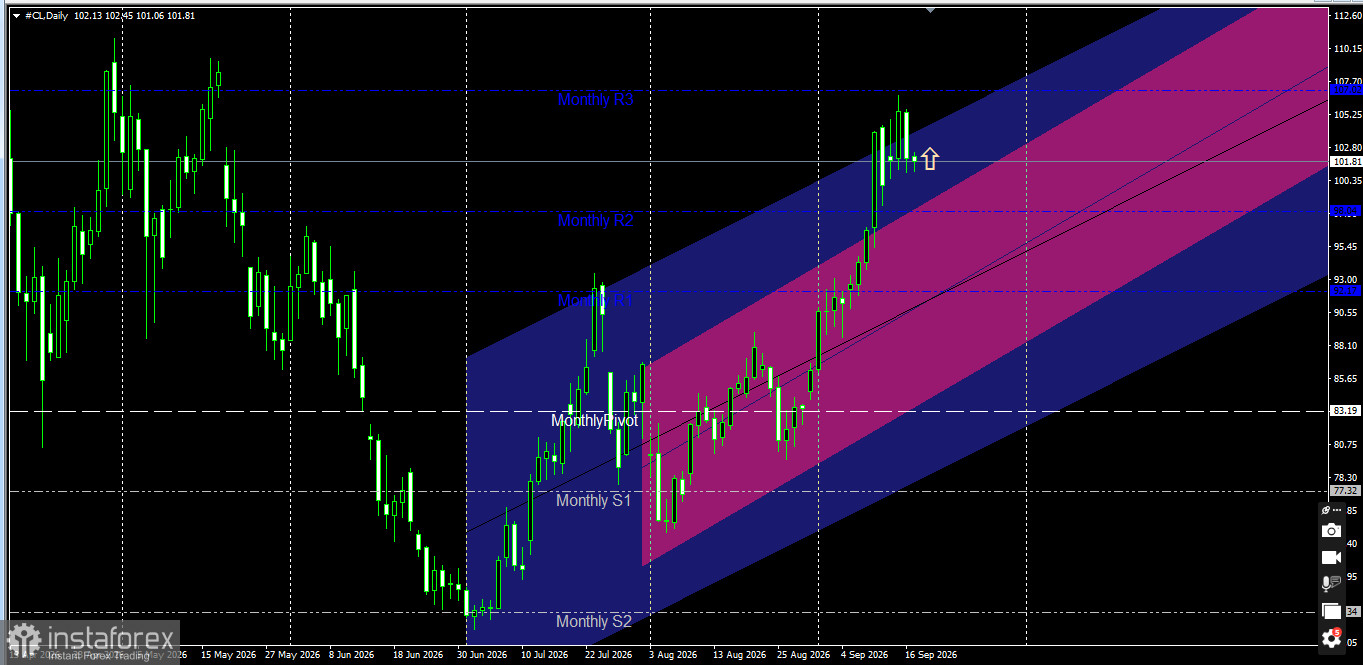
General Trend and Price Channels: The price is clearly moving within a primary ascending price channel (blue) and a narrower, steeper channel (pink) that reflects the movement's positive acceleration. The price previously managed to break above the second monthly resistance level (Monthly R2) at $98.04, which has now transformed into a strong, pivotal support level.
Interaction with Resistance and Pivot Levels: During its latest upward wave, the price approached the third monthly resistance level (Monthly R3)—spanning the $107.02–$107.70 range—before undergoing a corrective retest that successfully stabilized above the lower boundary of the pink channel.
Key Support Levels:
First Support: $100.35–$98.04 (including the previously broken Monthly R2 resistance level).
Pivotal Support: Monthly Pivot level at $83.19.
Key Resistance Levels:
First Resistance: $105.25 (upper boundary of the pink channel).
Main Resistance: $107.02–$107.70 (Monthly R3). Price Action Outlook and Trading Recommendations
1. Bullish Scenario (Primary):
The bullish scenario is the most likely outcome, given that the price remains stable within the pink channel and above the $98.04 support level.
Entry Point: Buy at current levels ($101.50 – $102.00) or upon a minor retest of the $100.35 area.
Technical Targets: Target the $105.25 level first, followed by a move toward the third monthly resistance zone at $107.02.
Stop Loss: A daily candle close below the $98.00 level.
2. Bearish Scenario (Alternative):
This scenario is triggered only if the price deviates from its current upward trajectory and breaks out of the immediate pink channel.
Validation Condition: A break below the $98.04 support level, confirmed by a full daily candle closing below it.
Technical Targets: In this case, the price would move into a deeper corrective phase, targeting the $92.17 level (Monthly R1) followed by the blue channel midline near $88.10.