 English
  Русский
 Bahasa Indonesia
 Bahasa Malay
 ไทย
ไทย Español
 Deutsch
 Български
 Français
 Tiếng Việt
 中文
中文 বাংলা
বাংলা हिन्दी
 Čeština
 Українська
 Română

Trend Analysis (Fig. 1)
On Tuesday, the market may continue moving upward from the 1.1692 level (closing of the previous daily candle), targeting 1.1739 – the 23.6% pullback level (yellow dashed line). Upon testing this level, the price may retrace downward to test the upper fractal at 1.1721 (daily candle from July 16, 2025).
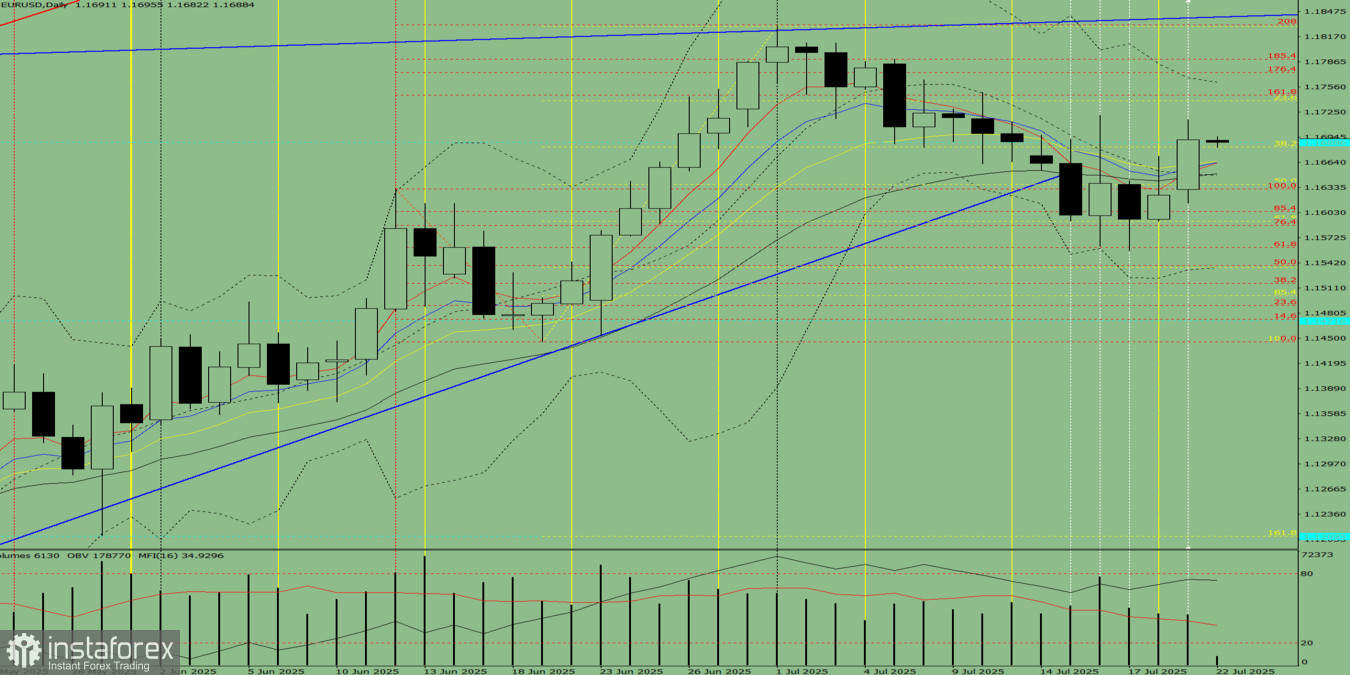
Fig. 1 (Daily Chart)
Composite Analysis:
- Indicator analysis – upward
- Volume analysis – upward
- Candlestick analysis – upward
- Trend analysis – upward
- Bollinger Bands – upward
- Weekly chart – upward
General Conclusion: Upward trend
Alternative Scenario:
From the 1.1692 level (closing of the previous daily candle), the price may continue to rise toward the 1.1739 pullback level (yellow dashed line). Upon testing this level, the price may further continue upward to test the target level at 176.4% – 1.1773 (red dashed line).