 English
  Русский
 Bahasa Indonesia
 Bahasa Malay
 ไทย
ไทย Español
 Deutsch
 Български
 Français
 Tiếng Việt
 中文
中文 বাংলা
বাংলা हिन्दी
 Čeština
 Українська
 Română

Trend Analysis
In August, the price from the level of 1.3203 (closing of the July monthly candle) may begin to move upward toward the target of 1.3539 – the 14.6% retracement level (red dashed line). Upon testing this level, the price may pull back downward toward the 23.6% retracement level at 1.3386 (red dashed line).
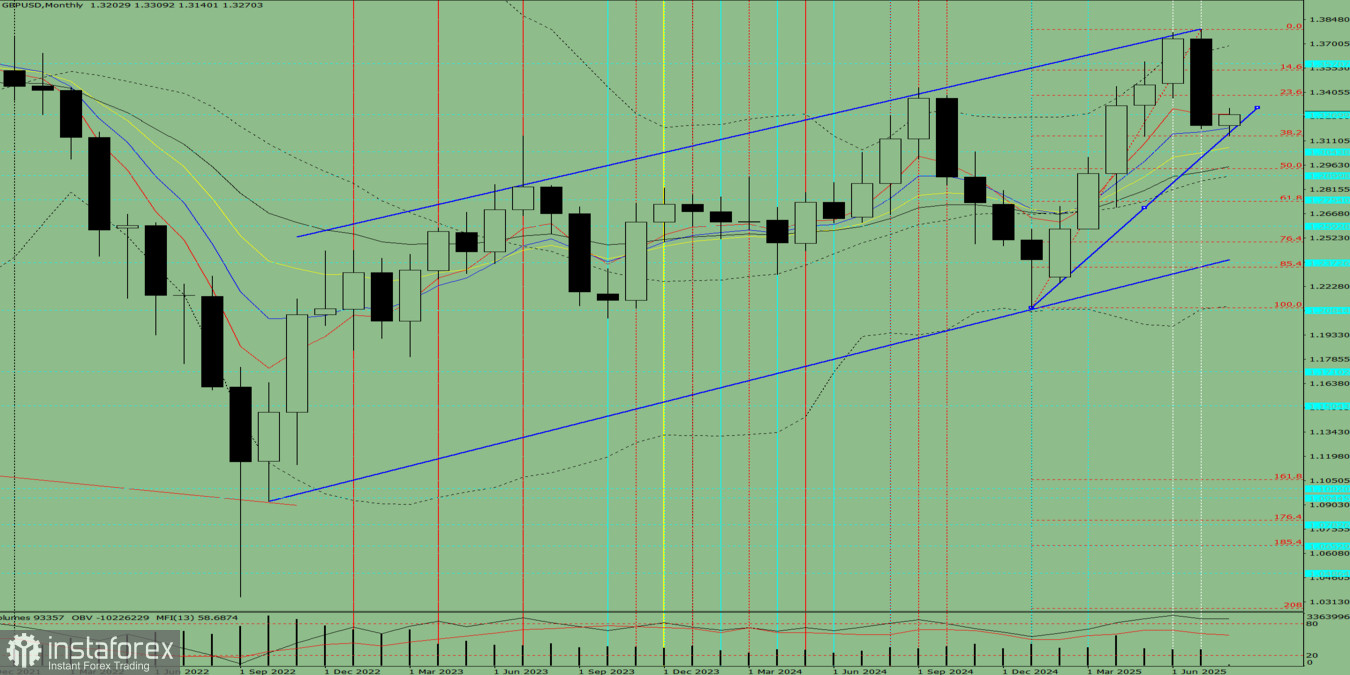
Fig. 1 (Monthly Chart)
Indicator Analysis:
- Indicator-based analysis – upward
- Fibonacci levels – upward
- Volumes – upward
- Candlestick analysis – upward
- Trend analysis – upward
- Bollinger Bands – upward
Conclusion based on comprehensive analysis: a potential upward trend.
General forecast for the GBP/USD monthly candle: The price is likely to show an upward trend, with no lower shadow on the monthly white candle (first week of the month – bullish), and an upper shadow (last week of the month – bearish).
Alternative Scenario: From the level of 1.3203 (closing of the July monthly candle), the price may begin to move upward toward the target of 1.3789 – upper fractal (red dashed line). Upon testing this level, the price may pull back downward toward 1.3591 – historical resistance level (blue dashed line).