 English
  Русский
 Bahasa Indonesia
 Bahasa Malay
 ไทย
ไทย Español
 Deutsch
 Български
 Français
 Tiếng Việt
 中文
中文 বাংলা
বাংলা हिन्दी
 Čeština
 Українська
 Română

Trend Analysis (Fig. 1)
On Thursday, from the level of 1.3353 (yesterday's daily close), the market may continue moving upward toward the 76.4% retracement level at 1.3416 (blue dotted line). From this level, the price may pull back downward toward 1.3385 – the 50% retracement level (red dotted line).
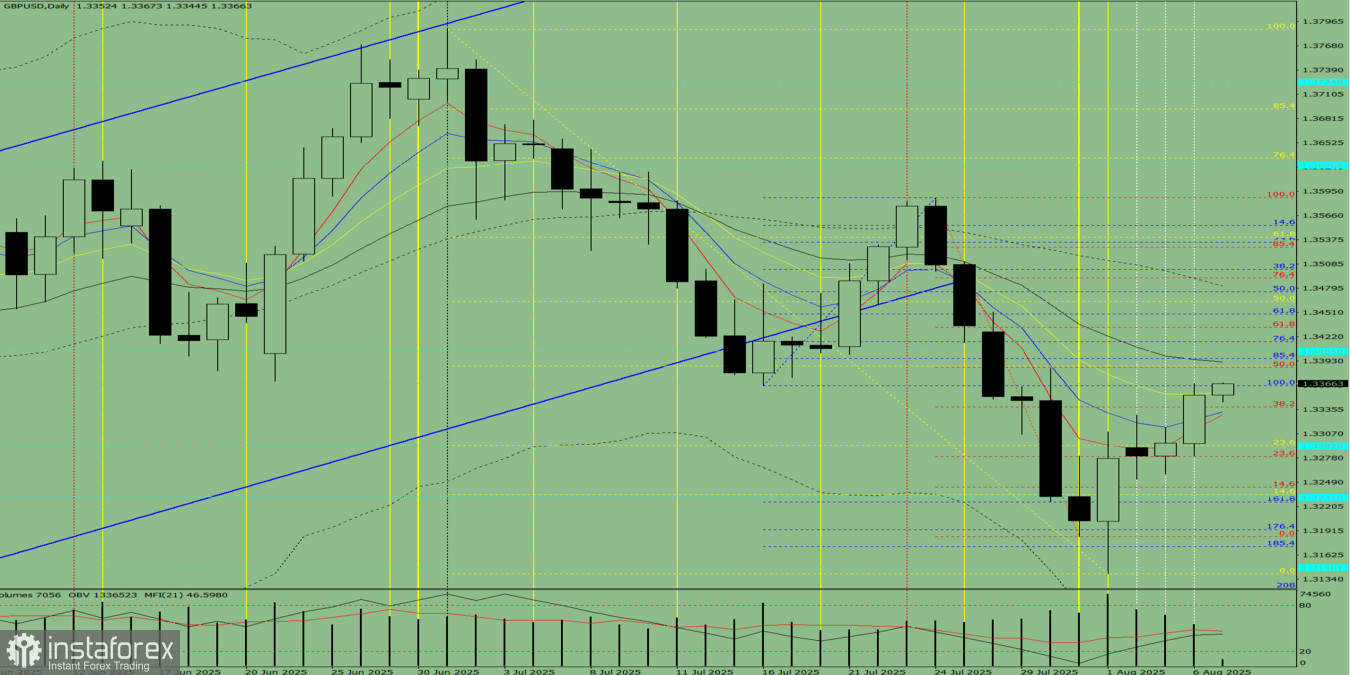
Fig. 1 (Daily Chart)
Comprehensive Analysis:
- Indicator analysis – upward
- Fibonacci levels – upward
- Volume – upward
- Candlestick analysis – upward
- Trend analysis – upward
- Bollinger Bands – upward
- Weekly chart – upward
Overall Conclusion: Upward trend
Alternative Scenario: From the level of 1.3353 (yesterday's daily close), the price may continue to rise toward 1.3416 – the 76.4% retracement level (blue dotted line). From this level, the price may extend its upward movement toward 1.3433 – the 61.8% retracement level (red dotted line).