 English
  Русский
 Bahasa Indonesia
 Bahasa Malay
 ไทย
ไทย Español
 Deutsch
 Български
 Français
 Tiếng Việt
 中文
中文 বাংলা
বাংলা हिन्दी
 Čeština
 Українська
 Română

Trend analysis (Fig. 1).
On Monday, from the level of 1.1734 (the closing of Friday's daily candle), the market may continue upward toward 1.1788 – the upper fractal (yellow dashed line). Upon reaching this level, a downward move toward 1.1747 – the upper fractal (daily candle of September 12, 2025) – is possible.
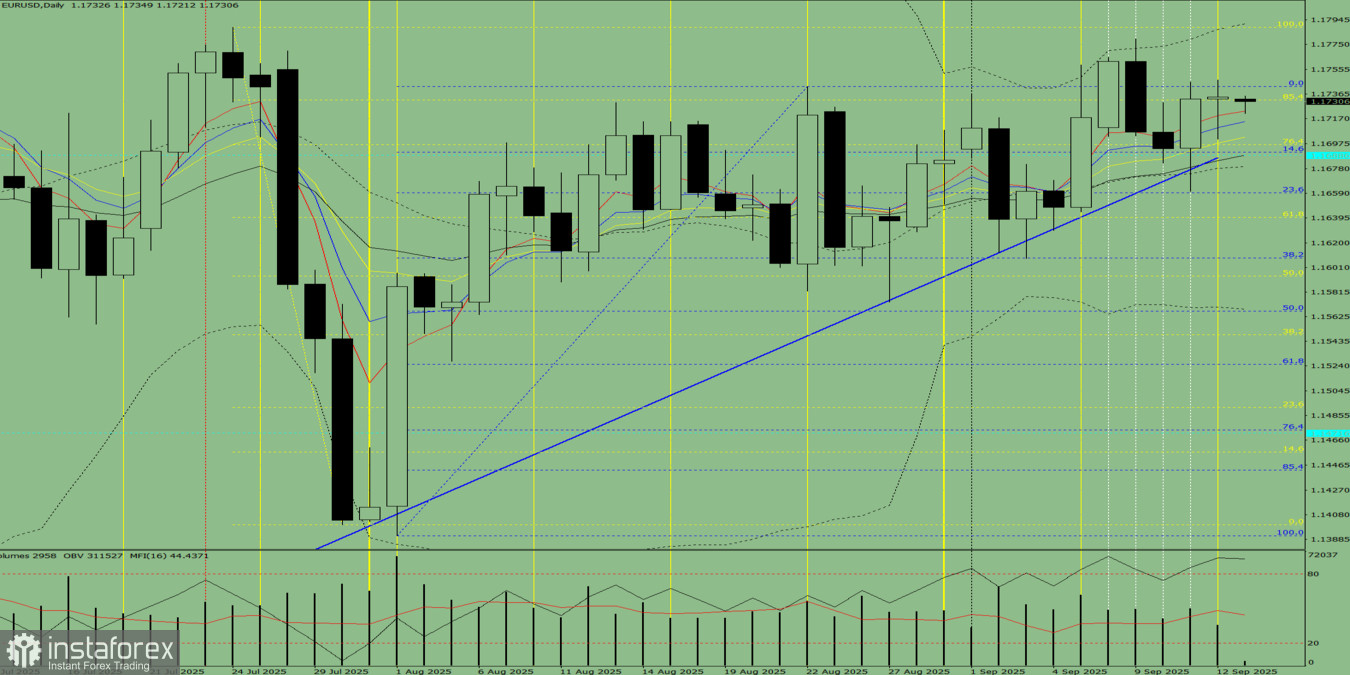
Fig. 1 (daily chart).
Comprehensive analysis:
- Indicator analysis – upward;
- Fibonacci levels – upward;
- Volumes – upward;
- Candlestick analysis – upward;
- Trend analysis – upward;
- Bollinger Bands – upward;
- Weekly chart – upward.
Overall conclusion: upward trend.
Alternative scenario: from the level of 1.1734 (the closing of Friday's daily candle), the price may continue upward toward 1.1747 – the upper fractal (daily candle of September 12, 2025). Upon reaching this level, a pullback downward toward 1.1697 – the 76.4% retracement level (yellow dashed line) – is possible.