 English
  Русский
 Bahasa Indonesia
 Bahasa Malay
 ไทย
ไทย Español
 Deutsch
 Български
 Français
 Tiếng Việt
 中文
中文 বাংলা
বাংলা हिन्दी
 Čeština
 Українська
 Română

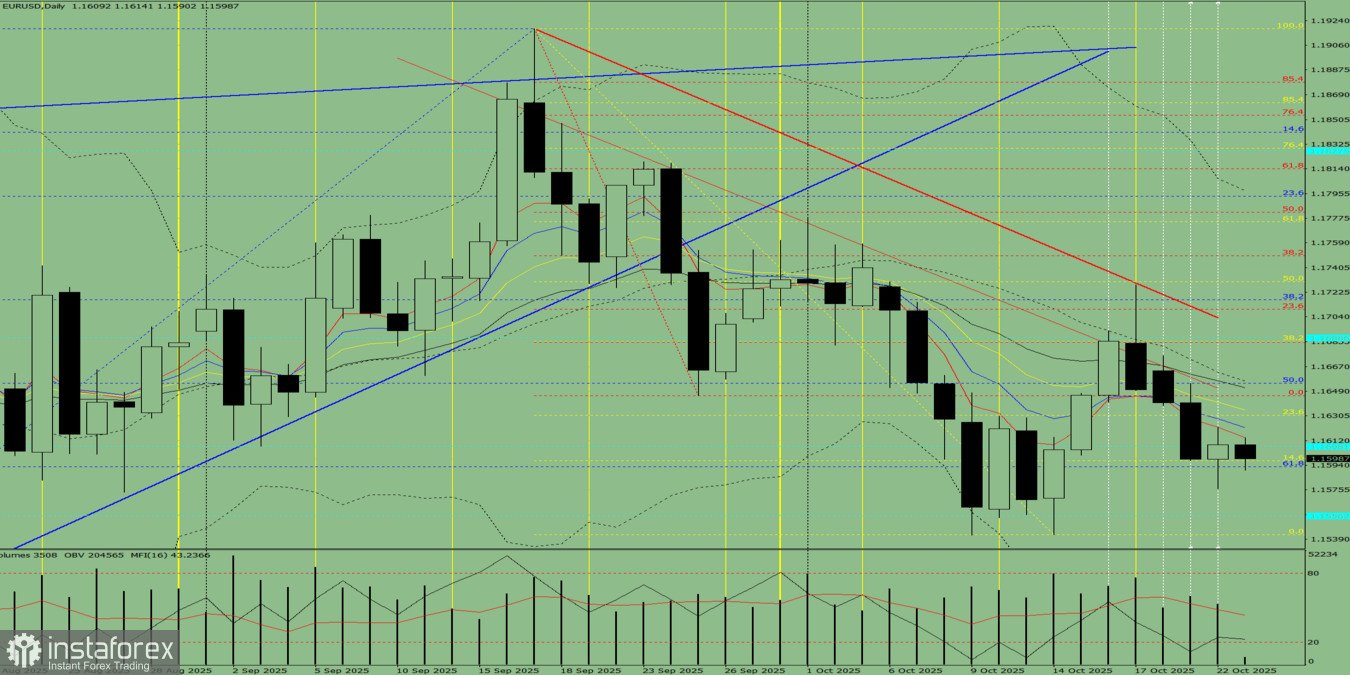
Fig. 1 (Daily Chart)
Comprehensive Analysis:
- Indicator analysis – downward
- Fibonacci levels – downward
- Volumes – downward
- Candlestick analysis – downward
- Trend analysis – downward
- Bollinger Bands – downward
- Weekly chart – downward
Overall conclusion: downward trend.
Alternative Scenario
On Thursday, the market may continue moving down from the 1.1609 level (the closing price of yesterday's daily candle) toward the 1.1593 level – the 61.8% retracement level (blue dotted line). Upon testing this level, the price may rebound upward toward 1.1609 – a historical resistance level (light blue dotted line).