 English
  Русский
 Bahasa Indonesia
 Bahasa Malay
 ไทย
ไทย Español
 Deutsch
 Български
 Français
 Tiếng Việt
 中文
中文 বাংলা
বাংলা हिन्दी
 Čeština
 Українська
 Română

Trend Analysis (Fig. 1).
On Monday, the market, from the level of 1.1512 (the close of Friday's daily candle), may begin moving upward toward 1.1556 — a historical resistance level (blue dashed line). Upon reaching this level, a downward move is possible toward 1.1546 — the 8-period EMA (thin blue line).
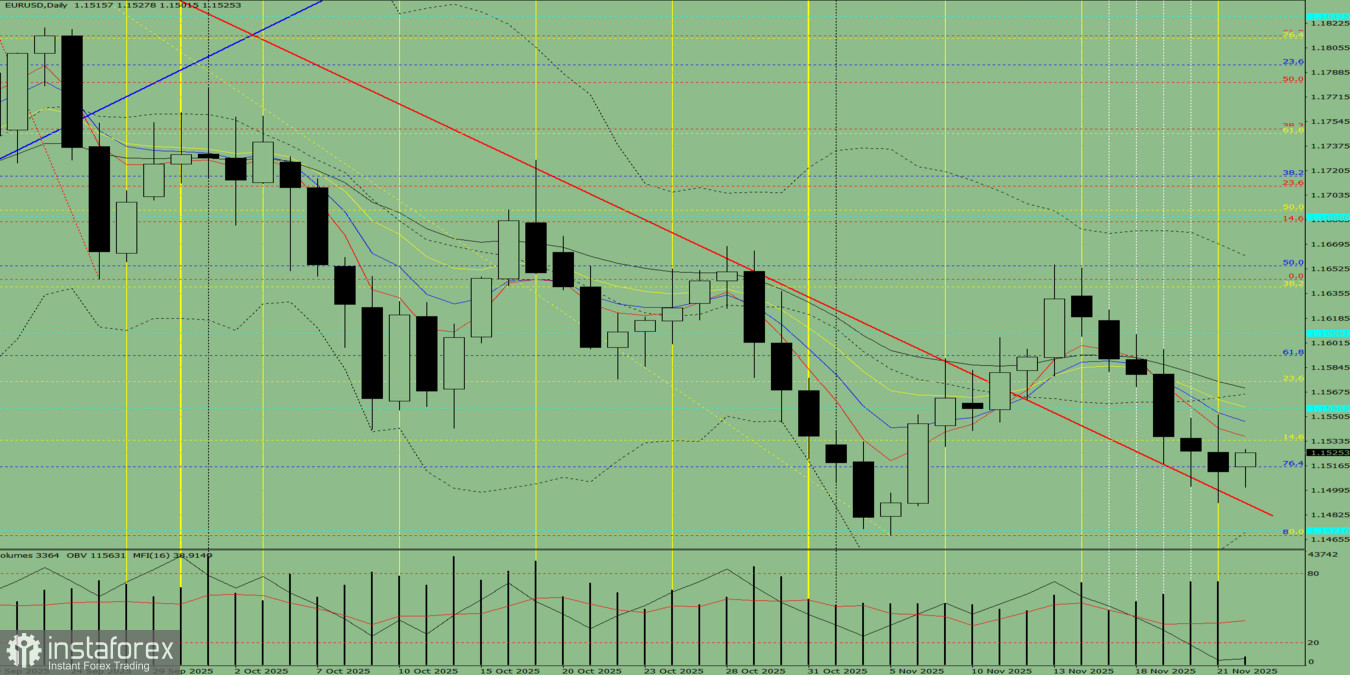
Fig. 1 (daily chart).
Comprehensive Analysis:
- Indicator analysis — upward;
- Fibonacci levels — upward;
- Volumes — upward;
- Candlestick analysis — upward;
- Trend analysis — upward;
- Bollinger Bands — upward;
- Weekly chart — upward.
Overall conclusion: upward trend.
Alternative scenario: From the level of 1.1512 (the close of Friday's daily candle), the price may begin moving upward toward 1.1546 — the 8-period average line (thin blue line).
Upon reaching this line, a pullback downward is possible toward 1.1534 — the 14.6% retracement level (yellow dashed line).