 English
  Русский
 Bahasa Indonesia
 Bahasa Malay
 ไทย
ไทย Español
 Deutsch
 Български
 Français
 Tiếng Việt
 中文
中文 বাংলা
বাংলা हिन्दी
 Čeština
 Українська
 Română

Trend Analysis (Fig. 1)
This week, from the level of 1.1598 (the close of the last weekly candle), the market may begin moving downward toward 1.1391 — the 61.8% retracement level (blue dashed line). When testing this level, the price may rebound upward toward 1.1488 — the historical resistance level (blue dashed line).
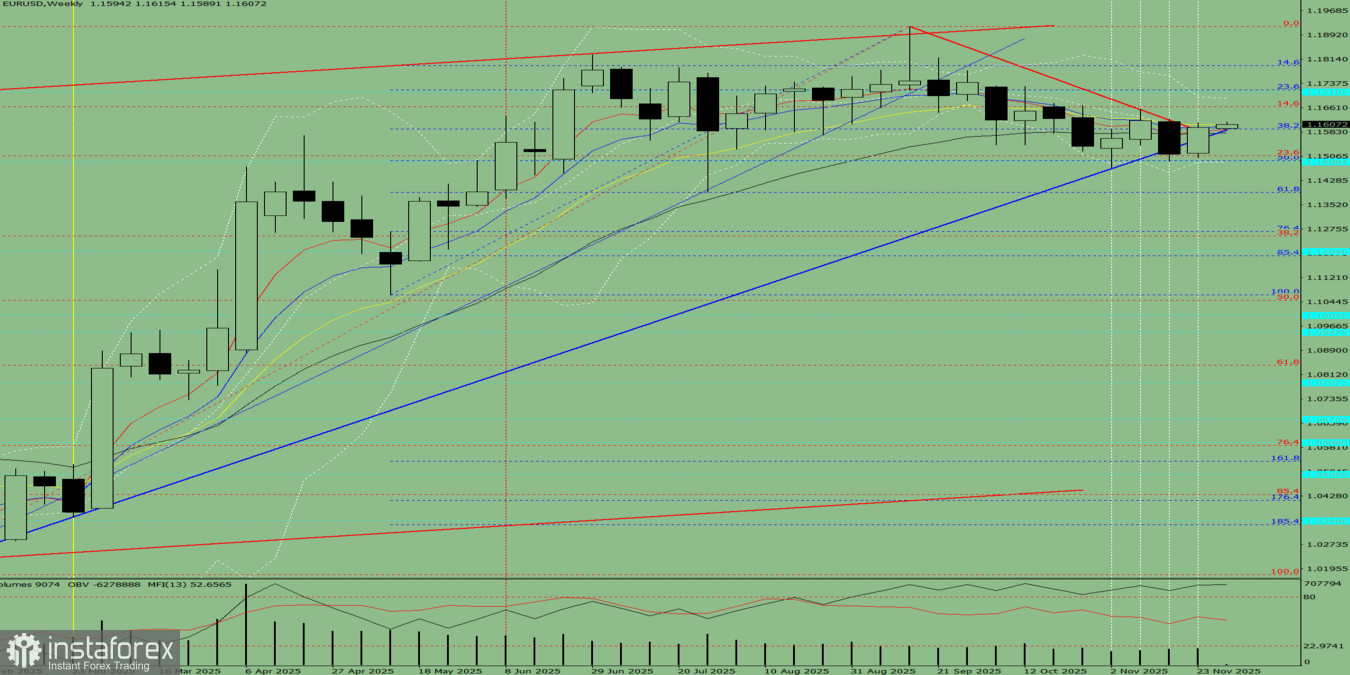
Fig. 1 (Weekly Chart).
Comprehensive Analysis:
- Indicator analysis — downward
- Fibonacci levels — downward
- Volume — downward
- Candlestick analysis — downward
- Trend analysis — downward
- Bollinger Bands — downward
- Monthly chart — downward
Conclusion from comprehensive analysis: downward movement.
Overall Summary for the Weekly EUR/USD Candle:
The price will most likely exhibit a downward tendency during the week, with the weekly bearish candle lacking the first upper shadow (Monday — down) and having a lower shadow (Friday — up).
Alternative Scenario:
From the level of 1.1598 (the close of the last weekly candle), the pair may begin moving downward toward 1.1492 — the 50% retracement level (blue dashed line). When testing this level, the price may rebound upward toward 1.1557 — the resistance line (bold blue line).