 English
  Русский
 Bahasa Indonesia
 Bahasa Malay
 ไทย
ไทย Español
 Deutsch
 Български
 Français
 Tiếng Việt
 中文
中文 বাংলা
বাংলা हिन्दी
 Čeština
 Українська
 Română

Analysis of Macroeconomic Reports:
There are a few macroeconomic reports scheduled for Friday, but some deserve traders' attention. In particular, reports on GDP and industrial production will be released in the UK. The GDP will be published in monthly figures, which hold much weaker significance than quarterly or yearly data. Industrial production is an important report, and a strong value may provoke additional strengthening of the British currency. In Germany, inflation data will be released, but this will be the second estimate for November. Therefore, this report attracts little interest.
Analysis of Fundamental Events:
Several fundamental events are scheduled for Friday. All of them involve speeches by members of the Federal Reserve's Monetary Committee. Recall that on Wednesday evening, the results of the last Fed meeting of the year were revealed. The key interest rate was lowered by 0.25% for the third consecutive time, and the FOMC Committee's expectations did not become more "dovish" (according to the "dot-plot" chart). Jerome Powell announced a pause in easing monetary policy until inflation demonstrates a sustainable trajectory towards the target level of 2%. Thus, the Fed clearly outlined its stance for 2026. It is unlikely that Fed officials will be able to add to the existing fundamental picture of the dollar.
General Conclusions:
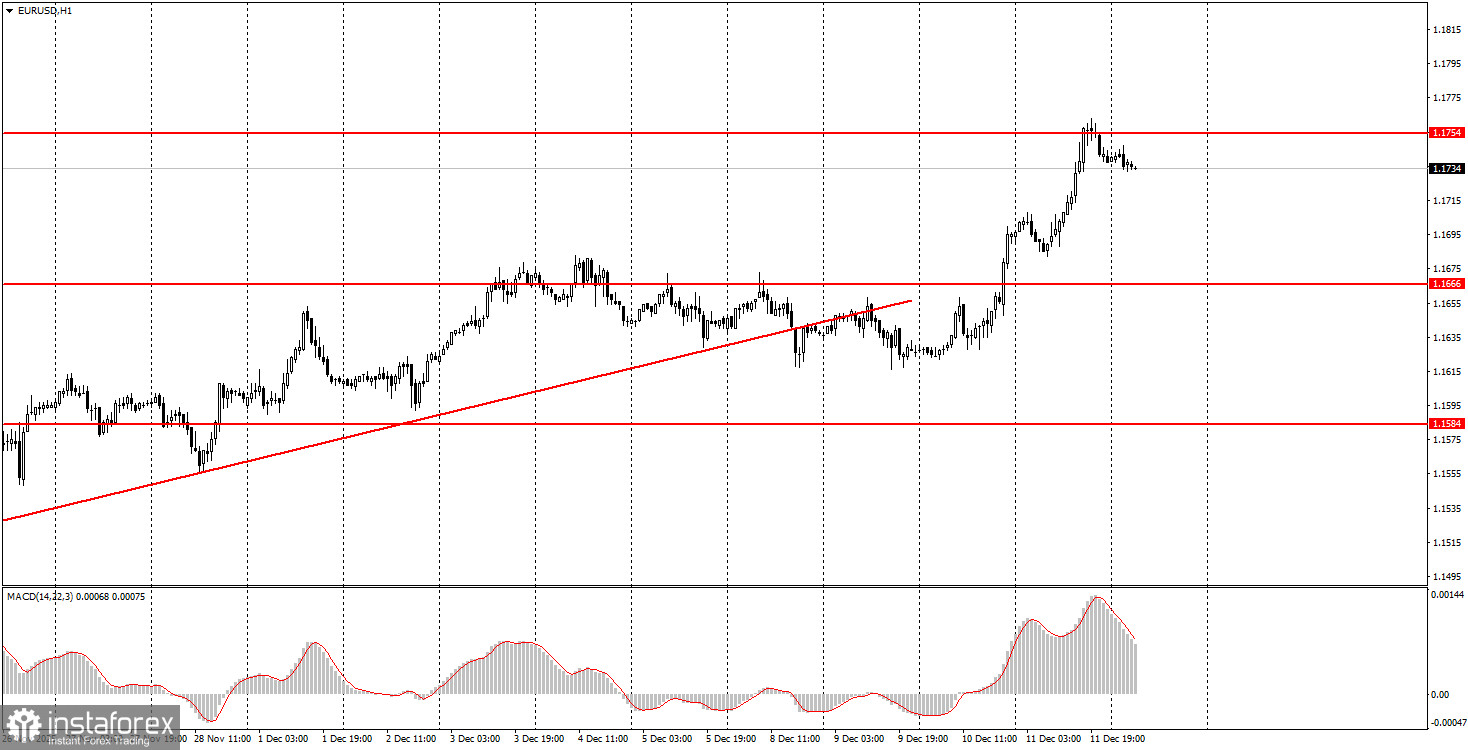
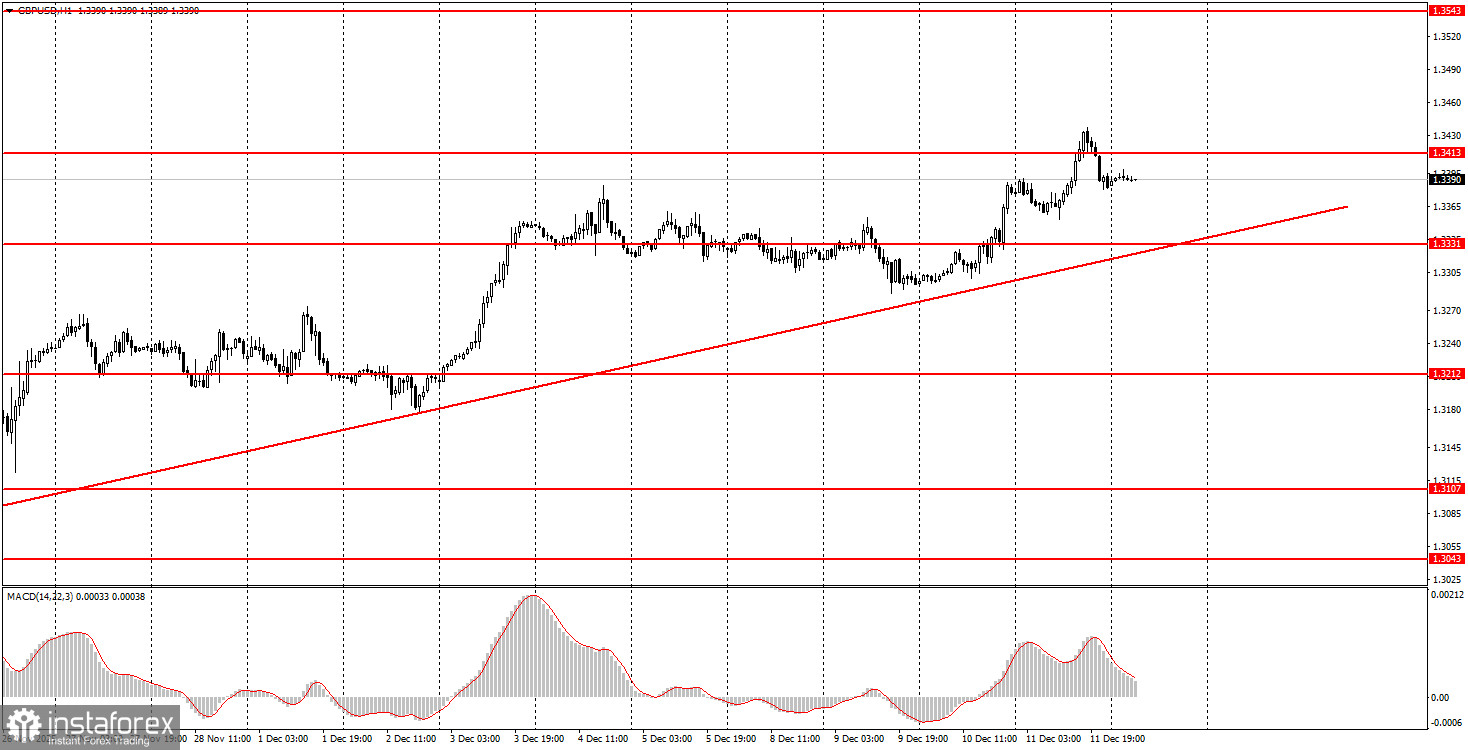
During the last trading day of the week, both currency pairs may again lean towards growth, as in both cases, an upward trend is still developing. The European currency has the area of 1.1745-1.1754 for position openings nearby, while the British pound has the area of 1.3413-1.3421. Volatility on Friday may be low, as the market has already reacted to the Fed meeting, and the macroeconomic backdrop will not be particularly strong today.
Key Rules of the Trading System:
- The strength of a signal is determined by the time it takes to form the signal (bounce or breakout). The less time it takes, the stronger the signal.
- If two or more trades were opened near a certain level based on false signals, all subsequent signals from that level should be ignored.
- In a flat, any pair can form a multitude of false signals or none at all. At the first signs of a flat, it is better to stop trading.
- Trades are opened during the time between the start of the European session and mid-American session, after which all trades should be closed manually.
- On the hourly timeframe, using signals from the MACD indicator, it is preferable to trade only when good volatility exists, and a trend is confirmed by a trend line or channel.
- If two levels are too close to each other (5 to 20 pips), they should be viewed as an area of support or resistance.
- After moving 15-20 pips in the right direction, a Stop Loss should be set to breakeven.
Chart Explanations:
- Support and Resistance Levels: Levels that serve as targets for opening buys or sells. Take Profit levels can be placed near them.
- Red Lines: Channels or trend lines that reflect the current trend and indicate the preferred direction to trade.
- MACD Indicator (14, 22, 3): A histogram and signal line, a supplementary indicator that can also be used as a source of signals.
Important Note: Significant speeches and reports (always included in the news calendar) can greatly influence the movement of the currency pair. Therefore, during their release, it is advisable to trade cautiously or exit the market to avoid sharp reversals against the preceding movement.
Remember: For beginners trading in the Forex market, it is crucial to understand that not every trade can be profitable. Developing a clear strategy and implementing sound money management are keys to successful long-term trading.