 English
  Русский
 Bahasa Indonesia
 Bahasa Malay
 ไทย
ไทย Español
 Deutsch
 Български
 Français
 Tiếng Việt
 中文
中文 বাংলা
বাংলা हिन्दी
 Čeština
 Українська
 Română

Analysis of Macroeconomic Reports:
Several macroeconomic reports are scheduled for Friday, but none of them are particularly significant. It should be noted that yesterday saw meetings of the Bank of England and the European Central Bank, along with the release of U.S. inflation data. These three important events did not provoke any substantial volatility or trending movements. Therefore, today's consumer confidence index in Germany, retail sales in the UK, and new home sales in the U.S. are unlikely to elicit a noticeable market reaction. In our opinion, the most interesting item appears to be the consumer sentiment index from the University of Michigan in the U.S.
Analysis of Fundamental Events:
A few fundamental events are scheduled for Friday. The only notable event is a speech by the ECB's Chief Economist, Philip Lane, but the market currently has no questions for the ECB. Questions do exist regarding the Federal Reserve and the BoE. Both central banks are likely to continue easing monetary policy next year, but the questions focus on the timing and scale of those actions, as well as the dynamics between the pound and the dollar in light of the declining key rates of both the BoE and the Fed.
General Conclusions:
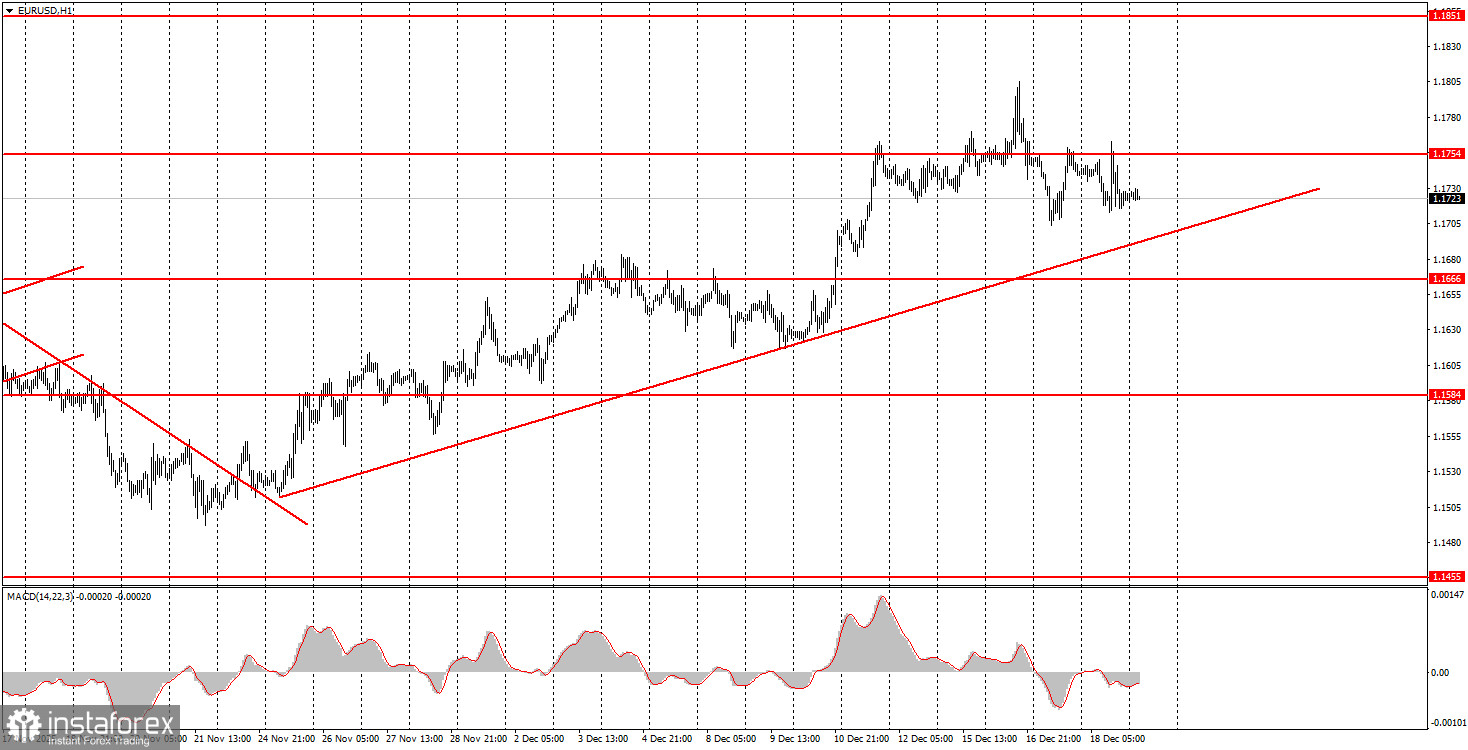
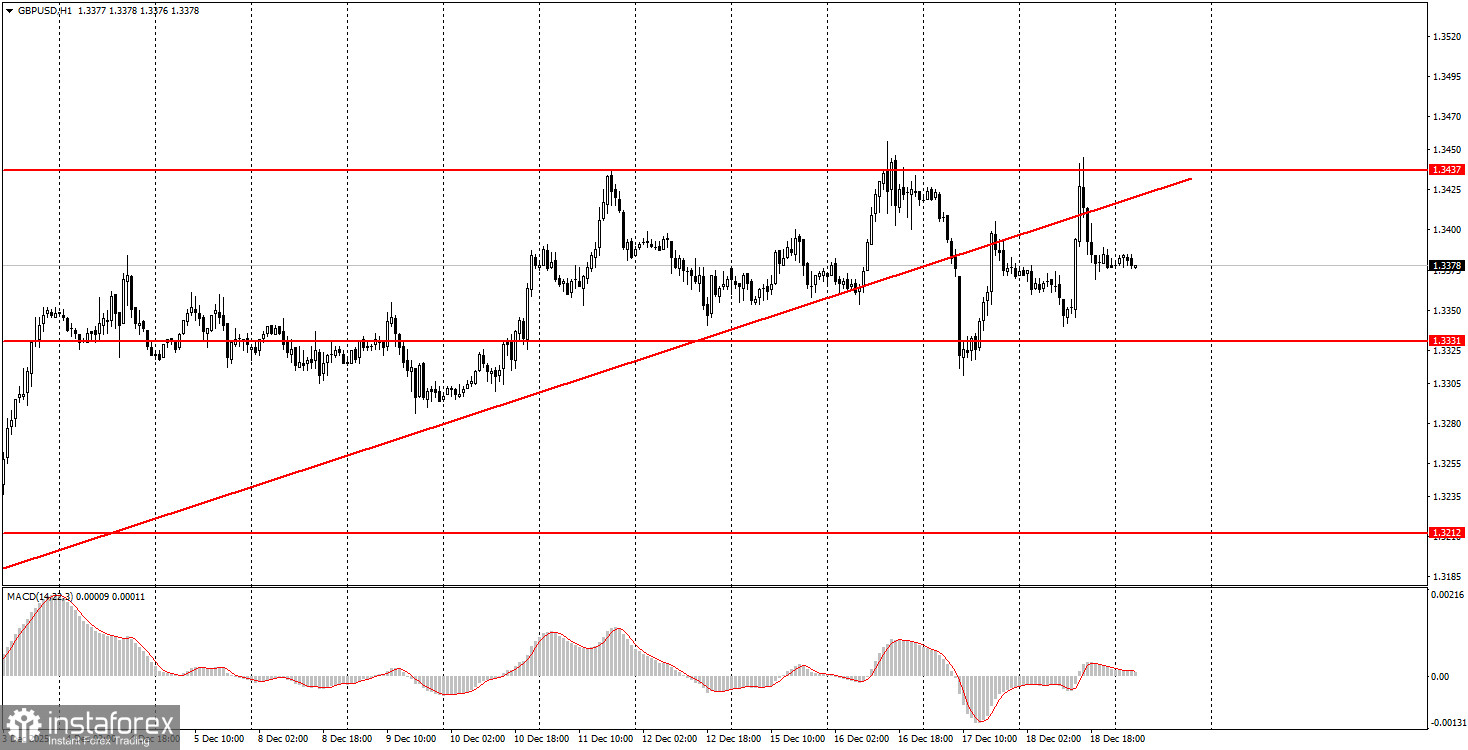
During the last trading day of the week, both currency pairs are expected to trade more on technical factors than on macroeconomic influences. The EUR/USD pair will likely continue to trade near the 1.1745-1.1754 area, where new trading signals should be sought. The GBP/USD pair is entirely flat, so trading should occur only at the boundaries of the sideways channel of 1.3319-1.3446. Volatility is unlikely to be high today.
Key Rules of the Trading System:
- The strength of a signal is assessed by the time it takes to form the signal (bounce or breakout). The less time it takes, the stronger the signal.
- If two or more trades were opened near any level based on false signals, all subsequent signals from that level should be ignored.
- In a flat, any pair can create numerous false signals or none at all. In any case, it's better to stop trading at the first signs of a flat.
- Trades are opened during the period between the start of the European session and the middle of the American session, after which all trades must be closed manually.
- On the hourly timeframe, when trading based on signals from the MACD indicator, it is preferable to trade only when good volatility is present, and a trend is confirmed by a trend line or channel.
- If two levels are positioned too closely to each other (5 to 20 points), they should be viewed as a support or resistance area.
- After moving 20 pips in the right direction, set the Stop Loss to breakeven.
Chart Explanation:
- Support and Resistance Levels: Levels that serve as targets for opening buys or sells. Take Profit levels can be placed near them.
- Red Lines: Channels or trend lines that reflect the current trend and indicate the preferred direction for trading.
- MACD Indicator (14, 22, 3): A histogram and signal line, a supplementary indicator that can also be used as a source of signals.
Important Note: Significant speeches and reports (always included in the news calendar) can greatly influence the movement of the currency pair. Therefore, during their release, it is advisable to trade cautiously or exit the market to avoid sharp reversals against the preceding movement.
Remember: For beginners trading in the Forex market, it is important to understand that not every trade can be profitable. Developing a clear strategy and practicing money management are keys to long-term trading success.