 English
  Русский
 Bahasa Indonesia
 Bahasa Malay
 ไทย
ไทย Español
 Deutsch
 Български
 Français
 Tiếng Việt
 中文
中文 বাংলা
বাংলা हिन्दी
 Čeština
 Українська
 Română

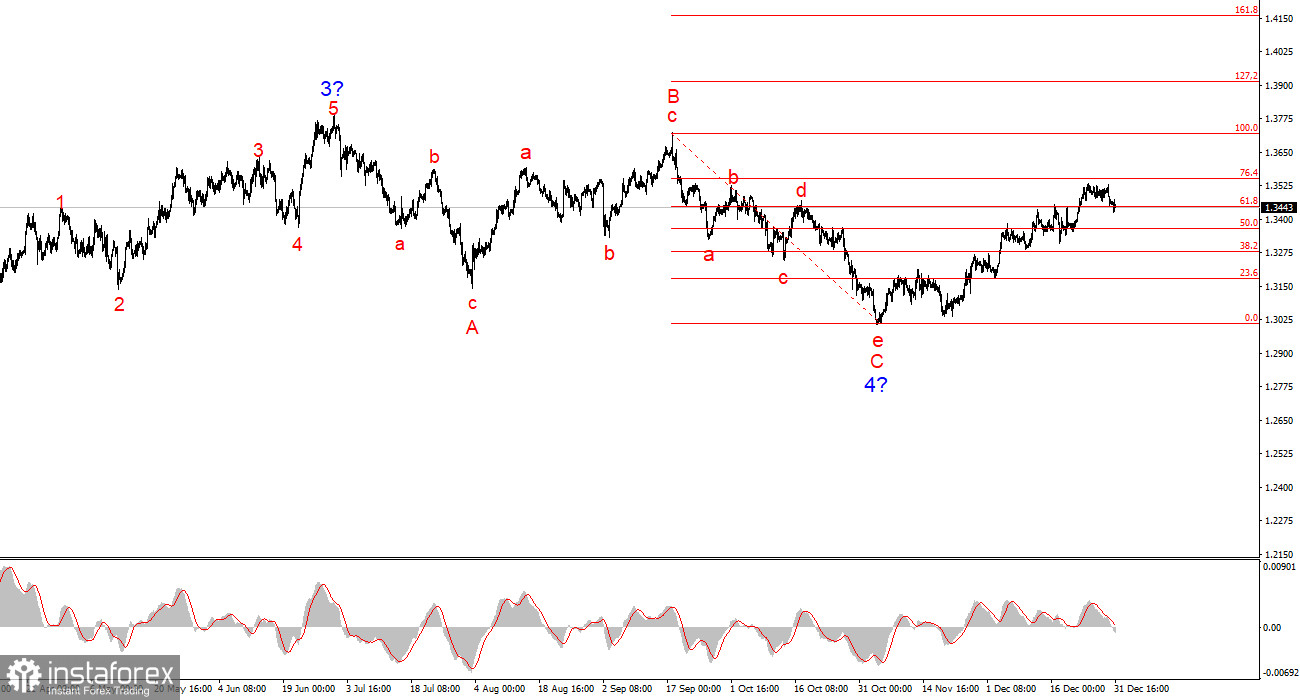
For the GBP/USD pair, the wave count continues to indicate the formation of an upward segment of the trend, but over the past six months it has taken on a complex corrective form. The trend segment that began on July 1 can be considered wave 4, or any global corrective wave, since it clearly has a corrective rather than an impulsive internal structure. The same applies to its internal sub-waves. The downward wave structure that began on September 17 has taken on a five-wave form (a–b–c–d–e) and has been completed. The instrument is now in the process of forming a new upward wave sequence.
Of course, any wave structure can become more complex at any moment and take on a more extended form. Even the presumed wave 4 could still develop into a five-wave structure, in which case we would observe a correction for several more months. However, at present there is a strong chance that an upward wave sequence is being formed. If this is indeed the case, then the first two waves of this segment have already been completed, and we are now observing the formation of wave 3 or c, which may also already be completed.
The GBP/USD pair has declined by several dozen basis points over the past few days, but overall it is still ending the year at fairly high levels. There are only about 350 points left to the 2025 highs of the instrument. This week, there were no important news releases or events; the market celebrated Christmas and is preparing for New Year's celebrations. Trading will close today, and the market will reopen only on Friday. However, on Friday the market may show a complete lack of interest in trading, as there will be no news at all and the market will effectively be open for just one day.
Based on all of the above, I believe that a resumption of full-fledged trading should be expected on Monday, January 5. The current wave count of the most recent upward trend segment does not look as convincing as that of EUR/USD, but it is precisely the EUR/USD pair that allows us to assume that the construction of wave 3 or c has been completed. If this is indeed the case, then we are likely to see at least the formation of wave 4, and at most a new downward wave sequence. In any case, a decline in the instrument should be expected in the near future regardless of the news background. The news background next week will largely determine whether this move turns out to be wave 4 or an entire wave sequence with further complication of the corrective structure that began 5–6 months ago.
General conclusions
The wave picture of the GBP/USD pair has changed. The downward corrective structure a–b–c–d–e within wave C of wave 4 appears complete, as does wave 4 as a whole. If this is indeed the case, I expect the main trend segment to resume its development with initial targets around the 38th and 40th levels.
In the short term, I expected the formation of wave 3 or c with targets around the 1.3280 and 1.3360 levels, which correspond to the 76.4% and 61.8% Fibonacci levels. These targets have been reached. Wave 3 or c is presumably complete, so I now expect a corrective wave, while the news background next week will determine the further direction of movement.
The higher-timeframe wave count looks almost ideal, even though wave 4 moved beyond the high of wave 1. However, I would like to remind you that ideal wave counts exist only in textbooks. In practice, everything is much more complicated. At the moment, I see no reason to consider alternative scenarios to the upward trend segment.
The main principles of my analysis:
- Wave structures should be simple and clear. Complex structures are difficult to trade and often signal changes.
- If there is no confidence in what is happening in the market, it is better not to enter it.
- There is no and never can be 100% certainty about the direction of movement. Do not forget to use protective Stop Loss orders.
- Wave analysis can be combined with other types of analysis and trading strategies.