 English
  Русский
 Bahasa Indonesia
 Bahasa Malay
 ไทย
ไทย Español
 Deutsch
 Български
 Français
 Tiếng Việt
 中文
中文 বাংলা
বাংলা हिन्दी
 Čeština
 Українська
 Română

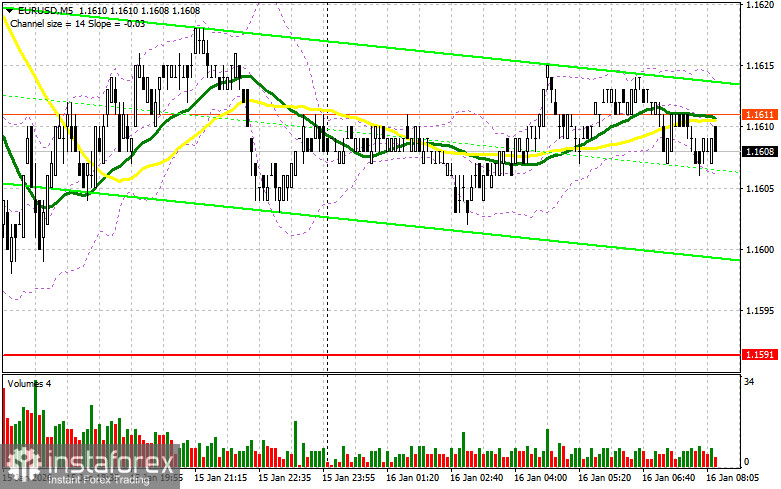
Yesterday, no entry points into the market were formed. Let's look at the 5-minute chart and figure out what happened there. In my morning forecast, I highlighted the 1.1624 level and planned to make entry decisions based on it. The decline toward 1.1624 occurred, but that level was not tested, so I ended up without trades. In the second half of the day, a sharp fall in the euro without a retest of support prevented me from entering short positions, so I missed the entire downward move of the pair.
For opening long positions on EURUSD requires:
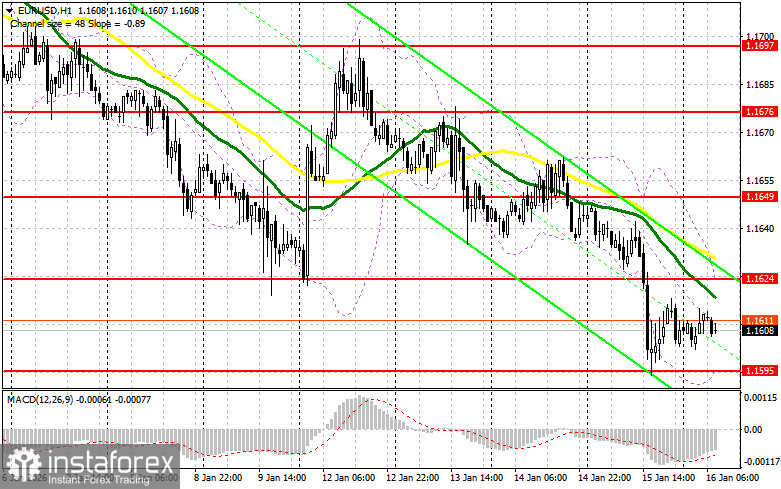
Yesterday's statements by Federal Reserve officials that recent labor-market and inflation data support a wait-and-see stance on rates and no rate cuts for now led to a strengthening of the US dollar. Today, in the first half of the day, we await Germany's CPI and Italy's CPI. These data are expected to match economists' forecasts and therefore not provide substantial support for the euro. If the pair continues to fall after the reports, buyers' hope will shift to the nearest support at 1.1595, which serves as the weekly low. Only the formation of a false breakout there will provide an entry for counter-trend long positions with a target of a small recovery to 1.1624. A breakout and retest of that range would confirm the correct action to buy the euro, aiming for a larger push to 1.1649, which would halt the bear market's development. The most distant target will be the high at 1.1676, where I will take profit. If EUR/USD falls and there is no activity around 1.1595, pressure on the pair will increase significantly and could lead to a larger downward move; in that case, bears will try to reach the next interesting level at 1.1558. Only a false breakout there would be an appropriate condition to buy the euro. Opening longs immediately on a bounce will be from 1.1527 with a target of an intraday upward correction of 30–35 pips.
For opening short positions on EURUSD requires:
Sellers continue to control the market. If inflation prints exceed expectations, the euro might rise slightly. In that case, I expect the bears to appear near the resistance at 1.1624. The formation of a false breakout there will provide an entry into short positions targeting a move to support at 1.1595. A breakout and consolidation below this range, plus a reverse test from below to above, will be an additional scenario to open shorts toward 1.1558, which would strengthen the bear market. The farthest target will be the 1.1527 area, where I will take profit. If EUR/USD moves up and bears are inactive around 1.1624 (where moving averages run and favor sellers), buyers will get a good opportunity for a larger recovery. In that case, short positions are best postponed until the larger level 1.1649; sell there only after a failed consolidation. I plan to open shorts immediately on a rebound from 1.1676, targeting a 30–35 pip downward correction.
Recommended for review:
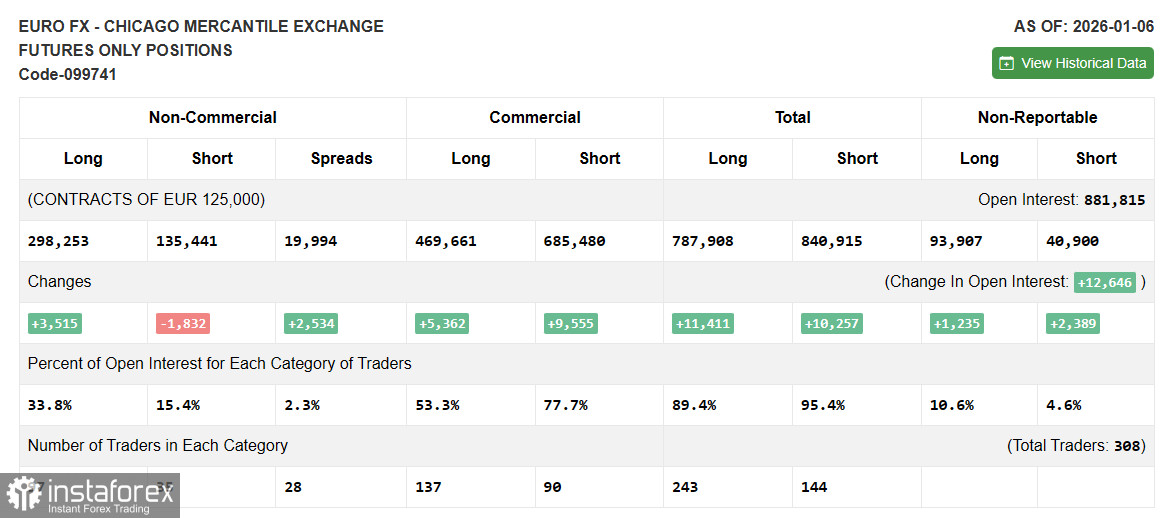
In the COT report (Commitment of Traders), as of January 6, there was an increase in long positions and a reduction in shorts. Expectations of a pause in the Fed's easing cycle do not help the US dollar to strengthen. The main reason is the difficulties the Fed has begun facing once more, and the pressure it is under from the Trump administration. Until this issue is fully resolved, traders will prefer risk assets. The COT report indicates non-commercial long positions rose by 3,515 to 298,253, while non-commercial short positions fell by 1,832 to 135,441. As a result, the spread between longs and shorts widened by 2,534.
Indicator signals:
Moving averages
Trading is taking place below the 30- and 50-day moving averages, which indicates possible euro weakness.
Note: The period and price basis of the moving averages are considered by the author on the hourly H1 chart and differ from the classic daily moving averages on the D1 chart.
Bollinger Bands
On a decline, the lower band of the indicator will provide support around 1.1595.
Indicator descriptions
- Moving average — smooths volatility and noise to determine the current trend. Period — 50. Marked in yellow on the chart.
- Moving average — smooths volatility and noise to determine the current trend. Period — 30. Marked in green on the chart.
- MACD (Moving Average Convergence/Divergence) — fast EMA period 12, slow EMA period 26, signal SMA period 9.
- Bollinger Bands — period 20.
- Non-commercial traders — speculators such as retail traders, hedge funds, and large institutions using the futures market for speculative purposes and meeting certain criteria.
- Non-commercial long positions — the total long open position of non-commercial traders.
- Non-commercial short positions — the total short open position of non-commercial traders.
- Net non-commercial position — the difference between non-commercial long and short positions.