 English
  Русский
 Bahasa Indonesia
 Bahasa Malay
 ไทย
ไทย Español
 Deutsch
 Български
 Français
 Tiếng Việt
 中文
中文 বাংলা
বাংলা हिन्दी
 Čeština
 Українська
 Română

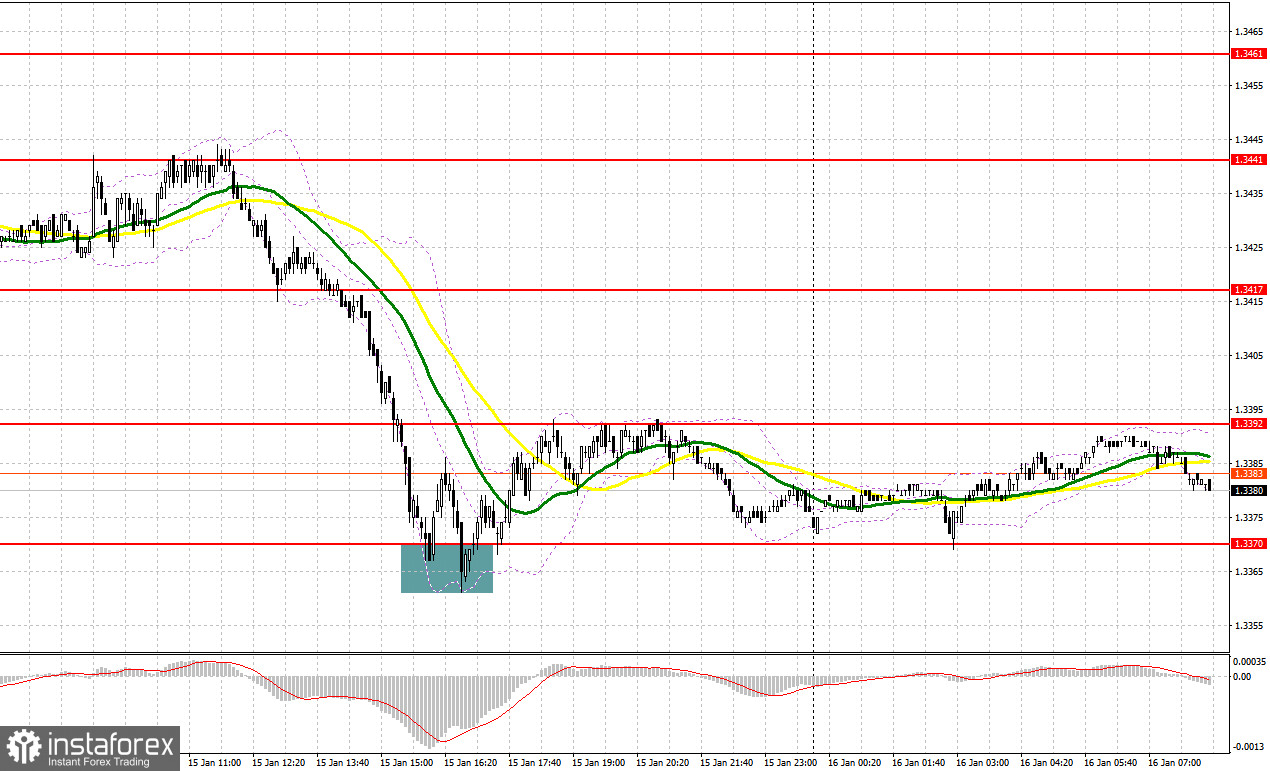
Yesterday, several entry points into the market were formed. Let's look at the 5-minute chart and figure out what happened there. In my morning forecast, I highlighted the 1.3441 level and planned to make entry decisions based on it. The rise and formation of a false breakout around 1.3441 led to a short entry on the pound, which resulted in the pair falling toward the target support at 1.3417. In the afternoon, only active buyer activity around 1.3370 produced a long entry on the pound with a reversal move toward resistance at 1.3392.
For opening long positions on GBPUSD requires:
Yesterday's strong US data, as well as statements from Federal Reserve officials that the recent data allow them to take a wait-and-see stance on rates and not to cut them yet, led to a strengthening of the US dollar and a decline in the British pound. There are no UK reports today, so the pound could easily continue to fall against the dollar already in the first half of the day. In that case, bulls can only count on the new support at 1.3363, formed on yesterday's results. Only the formation of a false breakout would be a good option for opening long positions, with a target to rise to the resistance at 1.3392. A breakout and a top-down retest of that range will restore chances for a GBP/USD rally, which will trigger sellers' stop orders and provide a suitable entry point for long positions with the possibility of exiting at 1.3417, where I expect a more active showing from the bears. The farthest target will be the area around 1.3441, where I plan to take profit. In the scenario of further GBP/USD decline and no buyer activity at 1.3363, pressure on the pair will only increase, leading to a move toward the next support at 1.3341. Only the formation of a false breakout will be a suitable condition for opening long positions. I plan to buy GBP/USD immediately on a bounce from the low of 1.3312, aiming for a 30–35-pip intraday correction.
For opening short positions on GBPUSD requires:
Sellers, having broken out of the weekly low, took control of the market. Given the lack of reports, bulls may show a bit more activity elsewhere, which could lead to a correction in the pair toward 1.3392. It is there that I expect more active actions from sellers. The formation of a false breakout at that level will be a reason to sell GBP/USD, aiming for a further decline toward support at 1.3363. A breakout and a bottom-up retest of that range will deliver a larger blow to buyers' positions, triggering stop orders and opening the way to 1.3341. The furthest target will be at 1.3312, where I will take profit. In the case of a GBP/USD rise and no activity at 1.3392, where the moving averages are located and play in the bears' favor, buyers will get a chance for a stronger correction toward 1.3417. I also plan to open short positions there only on a false breakout. If there is no downward move there either, I will sell GBP/USD immediately on a bounce from 1.3441, but only expecting an intraday correction of the pair downward by 30–35 pips.
Recommended for review:
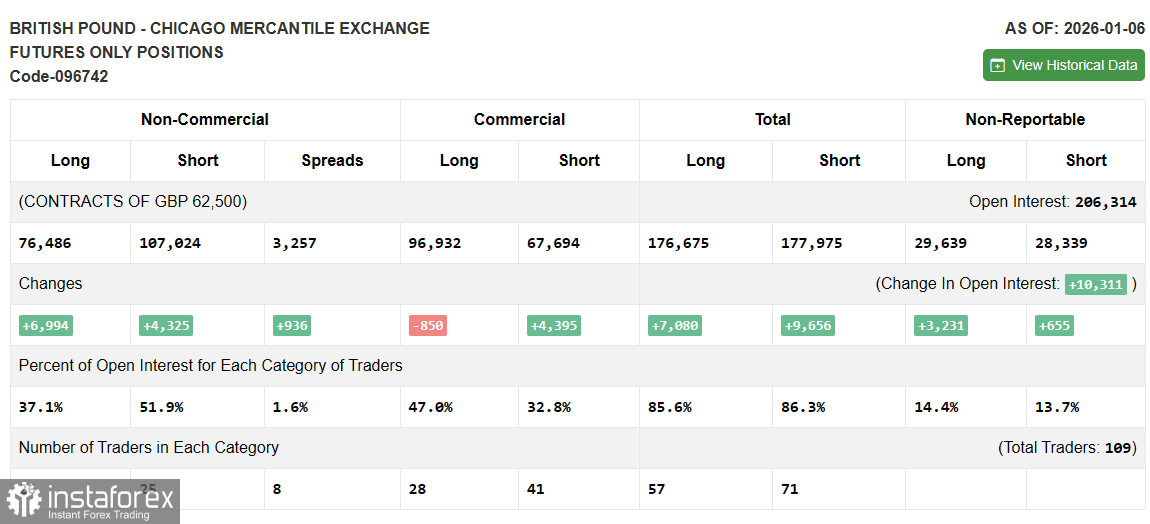
The COT report (Commitment of Traders) for January 6 showed an increase in both long and short positions. The probability of interest rate cuts in the US has weakened considerably after the latest US labor market data, but a new risk for the dollar has become intense pressure from the Trump administration on the Fed, which allows one to expect continued problems for the dollar and a rise in the British pound in the short term. At the same time, Bank of England policy remains measured, suggesting their clear plan to continue fighting inflation, though this has not given pound buyers much confidence lately. The latest COT report states that non-commercial long positions rose by 6,994 to 76,486, while non-commercial short positions increased by 4,325 to 107,024. As a result, the spread between long and short positions widened by 936.
Indicator signals:
Moving Averages
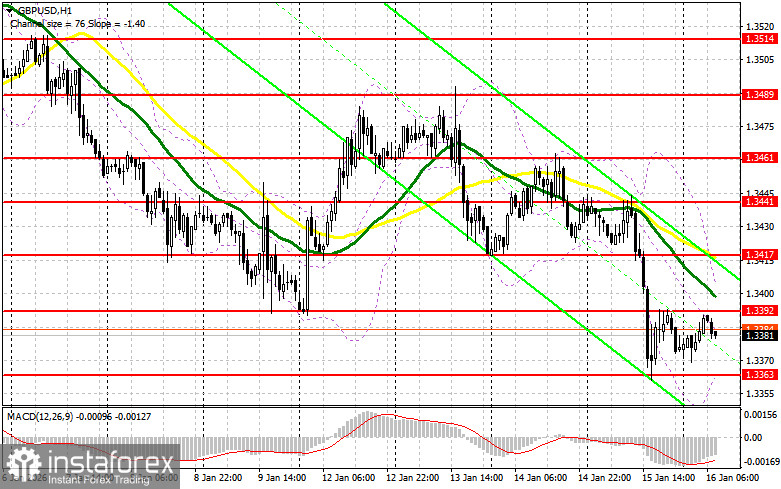
Trading is below the 30- and 50-period moving averages, suggesting a possible decline in the pair.
Note: The period and prices of the moving averages are considered by the author on the hourly chart H1 and differ from the general definition of classic daily moving averages on the daily chart D1.
Bollinger Bands
In case of a decline, the indicator's lower band around 1.3363 will act as support.
Indicator descriptions
- Moving average — smooths volatility and noise to determine the current trend. Period — 50. Marked in yellow on the chart.
- Moving average — smooths volatility and noise to determine the current trend. Period — 30. Marked in green on the chart.
- MACD (Moving Average Convergence/Divergence) — fast EMA period 12, slow EMA period 26, signal SMA period 9.
- Bollinger Bands — period 20.
- Non-commercial traders — speculators such as retail traders, hedge funds, and large institutions using the futures market for speculative purposes and meeting certain criteria.
- Non-commercial long positions — the total long open position of non-commercial traders.
- Non-commercial short positions — the total short open position of non-commercial traders.
- Net non-commercial position — the difference between non-commercial long and short positions.