 English
  Русский
 Bahasa Indonesia
 Bahasa Malay
 ไทย
ไทย Español
 Deutsch
 Български
 Français
 Tiếng Việt
 中文
中文 বাংলা
বাংলা हिन्दी
 Čeština
 Українська
 Română

Review of Tuesday's trades:
1H chart of the GBP/USD pair
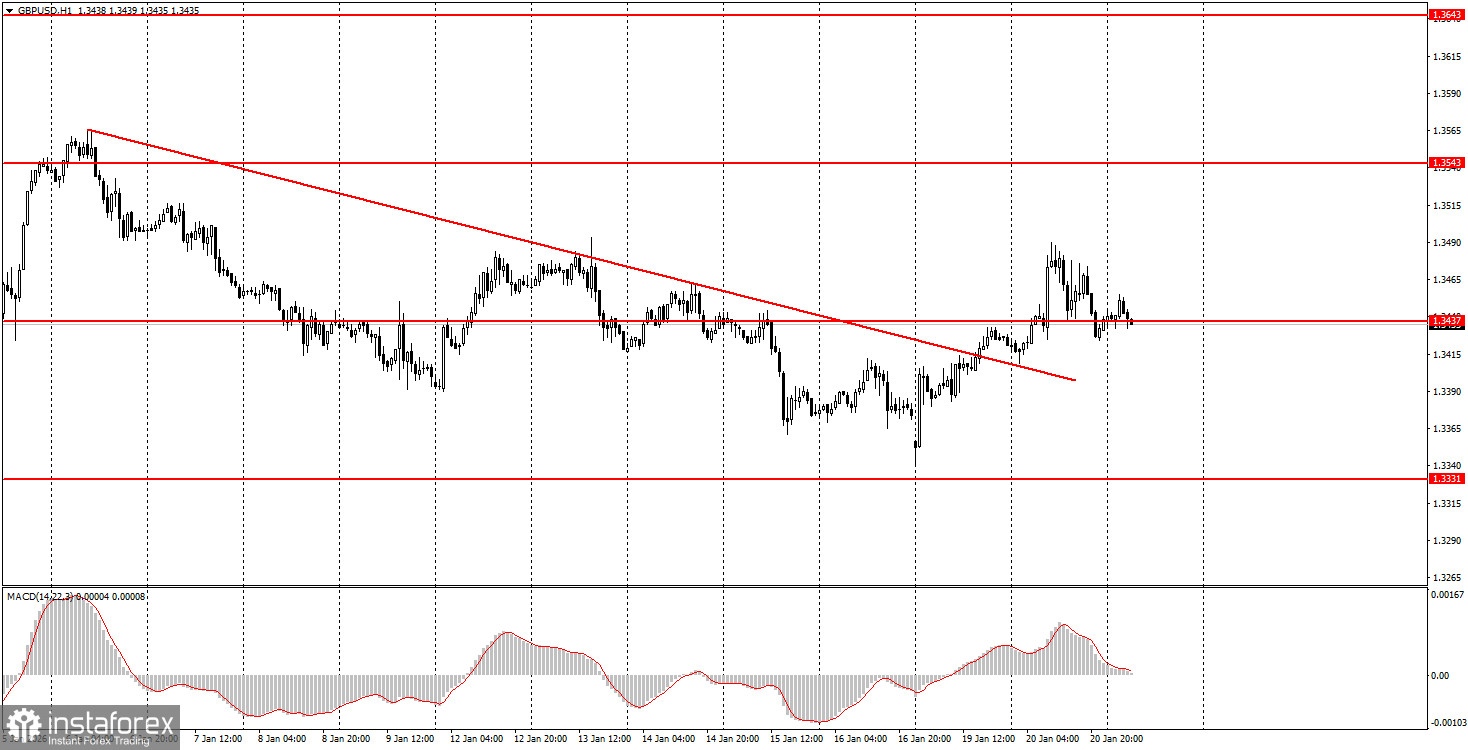
The GBP/USD pair also traded higher on Tuesday, but only briefly. In the morning, the UK released reports on unemployment, initial jobless claims and wages. These reports cannot be called failures, but neither were they strong. In our view, they restrained the pound's rise. The euro had no such reports, which is why EUR/USD rose much more. Thus, the UK unemployment rate remained unchanged at 5.1% in November. The number of new unemployed amounted to 18,000 against lower forecasts. Wage growth was 4.7% versus lower forecasts. Overall, the labour data constrained buyers, but the pound nevertheless broke the descending trendline, so the trend changed to bullish. Now the key thing is for the seven-month flat in the euro pair to end. If the euro resumes the global uptrend of 2025, it will be much easier for the pound to rise as well.
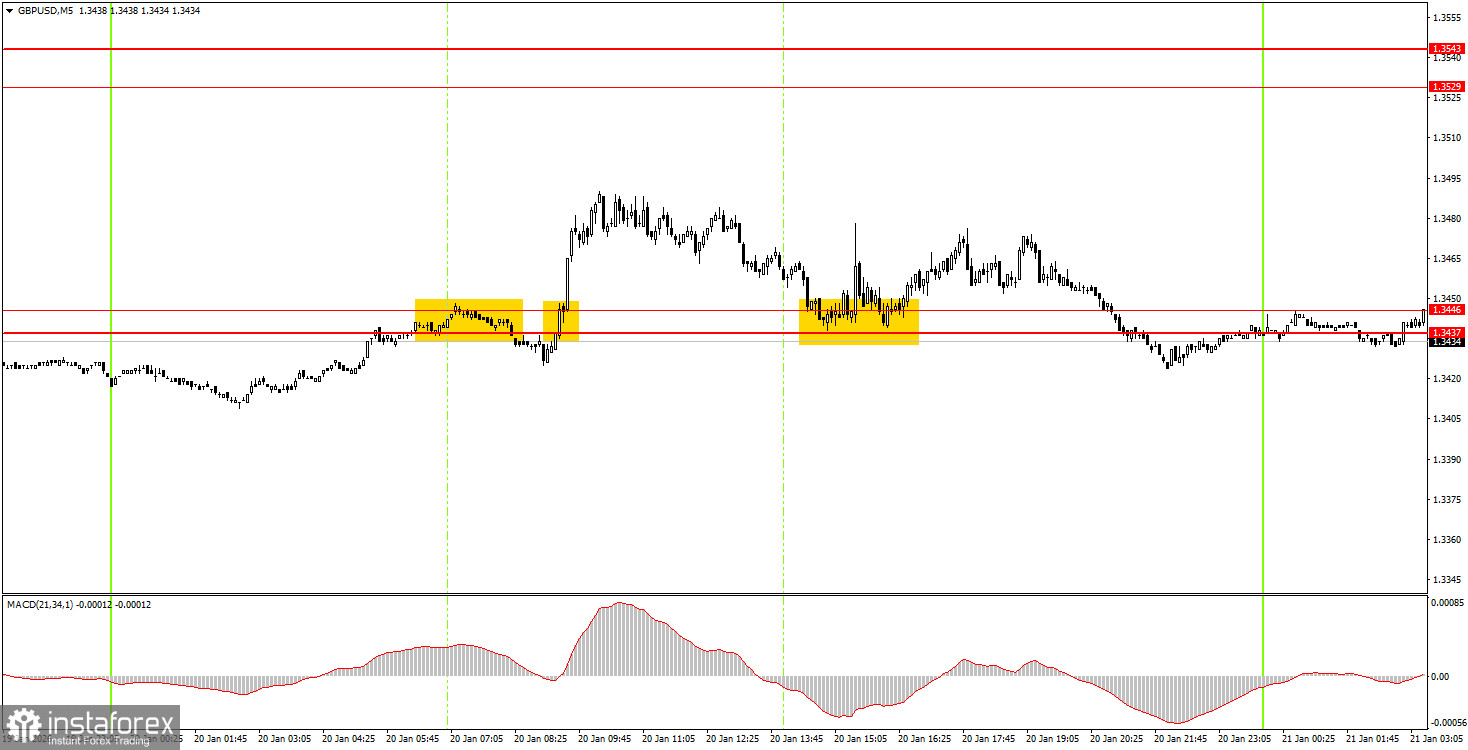
5M chart of the GBP/USD pair
How to trade on Wednesday:
On the hourly TF, the GBP/USD pair has turned north, so in the coming weeks, one can expect the pound to rise. There are no global grounds for a medium-term dollar rally, so in 2026, we expect only upside moves. Overall, we also expect the resumption of the global 2025 uptrend, which could bring the pair to 1.4000 within the next couple of months. Donald Trump's policy still does not imply USD strength.
On Wednesday, novice traders may consider short positions if the pair consolidates below the 1.3437–1.3446 area, targeting 1.3319–1.3331. Consolidation above the 1.3437–1.3446 area will allow opening new long positions targeting 1.3529–1.3543.
On the 5-minute TF, you can trade the levels 1.3043, 1.3096–1.3107, 1.3203–1.3212, 1.3259–1.3267, 1.3319–1.3331, 1.3437–1.3446, 1.3529–1.3543, 1.3574–1.3590, 1.3643–1.3652, 1.3682, 1.3763. On Wednesday, the UK will publish an important inflation report that may determine the pound's dynamics during the European session. No major events are scheduled for the afternoon, but any news related to Greenland could trigger another dollar sell-off.
Main rules of the trading system:
- Signal strength is judged by the time required to form the signal (rebound or breakout). The less time required, the stronger the signal.
- If two or more trades were opened on false signals near a level, then all subsequent signals from that level should be ignored.
- In a flat, any pair can generate many false signals or none at all. In any case, at the first signs of a flat, it is better to stop trading.
- Trades are opened between the start of the European session and the middle of the American session; after that, all trades must be closed manually.
- On the hourly timeframe, MACD-based signals should be traded only when there is good volatility and a trend confirmed by a trendline or trend channel.
- If two levels are located too close to each other (5–20 pips), they should be considered a support or resistance area.
- After the price moves 20 pips in the correct direction, set the stop loss to breakeven.
What is shown on the charts:
Support and resistance price levels — levels that serve as targets when opening buys or sells. Take Profit can be placed near them.
Red lines — channels or trendlines that reflect the current tendency and show which direction is preferable to trade now.
MACD indicator (14,22,3) — histogram and signal line — an auxiliary indicator that can also be used as a source of signals.
Important speeches and reports (always listed in the news calendar) can strongly affect a currency pair's movement. Therefore, during their release, trading should be done with maximum caution, or positions should be closed, to avoid a sharp price reversal against the preceding move.
Beginner forex traders should remember that not every trade can be profitable. Developing a clear strategy and effective money management are the keys to long-term trading success.