 English
  Русский
 Bahasa Indonesia
 Bahasa Malay
 ไทย
ไทย Español
 Deutsch
 Български
 Français
 Tiếng Việt
 中文
中文 বাংলা
বাংলা हिन्दी
 Čeština
 Українська
 Română

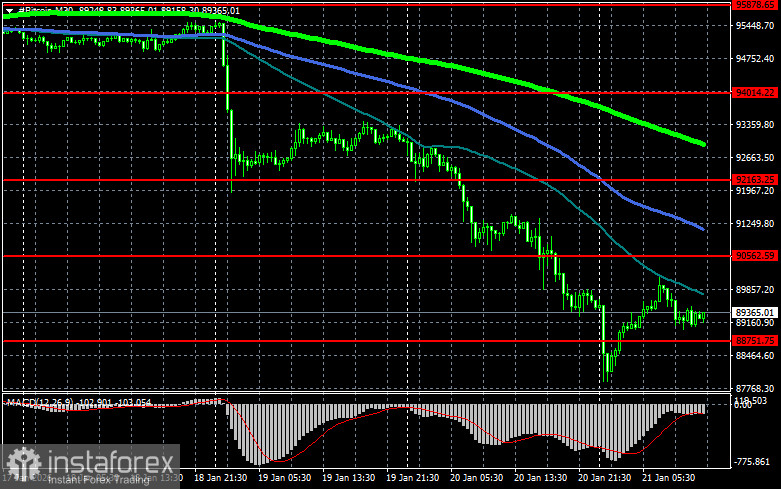
Bitcoin is in no rush to resume its rally. It is still erasing its gains recovered after a sharp plunge toward about $88,000 during the Asian session.

Meanwhile, amid the crypto market decline, US ETFs investing in spot Bitcoin recorded net outflows of $483 million, and ETFs investing in Ethereum saw net outflows of $230 million. All this is unfolding against the backdrop of geopolitical tensions between the US and the EU.
The drop in interest in crypto ETFs came amid a broad asset sell?off driven by rising fears of an escalation in the US–EU conflict. Investors are seeking to move funds into safer assets such as gold, which is weighing on crypto markets.
Despite the negative dynamics, many analysts remain optimistic about cryptocurrencies' long?term prospects. They emphasize that the current correction is temporary and does not reflect the fundamental value of Bitcoin and Ethereum. Institutional investors view cryptocurrencies as an attractive asset class with high growth potential, and are expected to return to the market once geopolitical tensions stabilize. According to the latest data, their active accumulation of BTC is only increasing.
Once the current geopolitical conflict eases and regulation progresses — notably, consideration of the CLARITY bill, which aims to define federal oversight of digital assets and increase transparency in crypto markets — new investor inflows are expected, which should support Bitcoin and Ethereum prices.
Trading recommendations
Bitcoin
Buyers are currently targeting a return to $90,500, which opens a direct path to $92,100 and then to $94,000. The far target is around $95,800; breaking that would signal attempts to restore the bull market. In case of a decline, buyers are expected at $88,700. A move back below that area could quickly push BTC toward $86,300. The far downside target is $83,200.
Ethereum
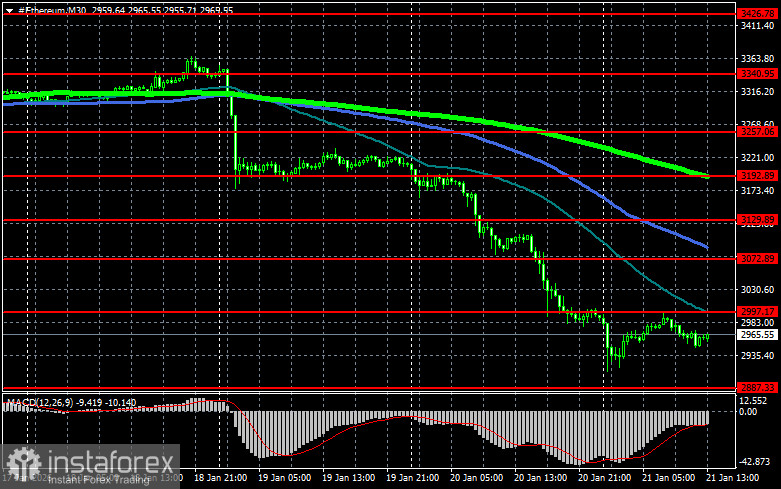
A clear hold above $2,997 opens a direct path to $3,072. The far target is around $3,129; surpassing that would indicate strengthening bullish sentiment and renewed buyer interest. In case of a decline, buyers are expected at $2,887. A move back below that area could quickly push ETH toward $2,789. The far downside target is $2,684.
Chart indicators
- Red indicators represent support and resistance levels, where a slowdown or active price increase is expected.
- Green represents the 50-day moving average.
- Blue indicates the 100-day moving average.
- Light green signifies the 200-day moving average.
Crossovers or tests of the moving averages usually halt or set the market's momentum.