 English
  Русский
 Bahasa Indonesia
 Bahasa Malay
 ไทย
ไทย Español
 Deutsch
 Български
 Français
 Tiếng Việt
 中文
中文 বাংলা
বাংলা हिन्दी
 Čeština
 Українська
 Română

Analysis GBP/USD 5M
The GBP/USD currency pair fluctuated sharply on Wednesday. In the first half of the day, the UK inflation report for December was published, which provoked a very strange market reaction. In the second half of the day, speeches by senior officials began at Davos, including Donald Trump. Since one never knows when Trump is joking or speaking seriously, it is unsurprising that the pair began to be tossed about. What does Trump's rhetoric mean, in which he criticized the European Union and urged it to take the US as an example? Will annexing Greenland be followed by annexations of fully fledged states? Were there any talks with European leaders aimed at avoiding conflict within NATO? Traders did not receive answers to these questions.
Returning to the inflation report, the consumer price index accelerated to 3.4% against lower forecasts. Essentially, only one conclusion can be drawn. If the Bank of England had planned a near-term rate cut, it would have to abandon those plans. We said earlier that inflation in the United Kingdom remains high enough that rates should not be cut even at every second meeting. However, instead of a logical rise, the pound fell in the morning.
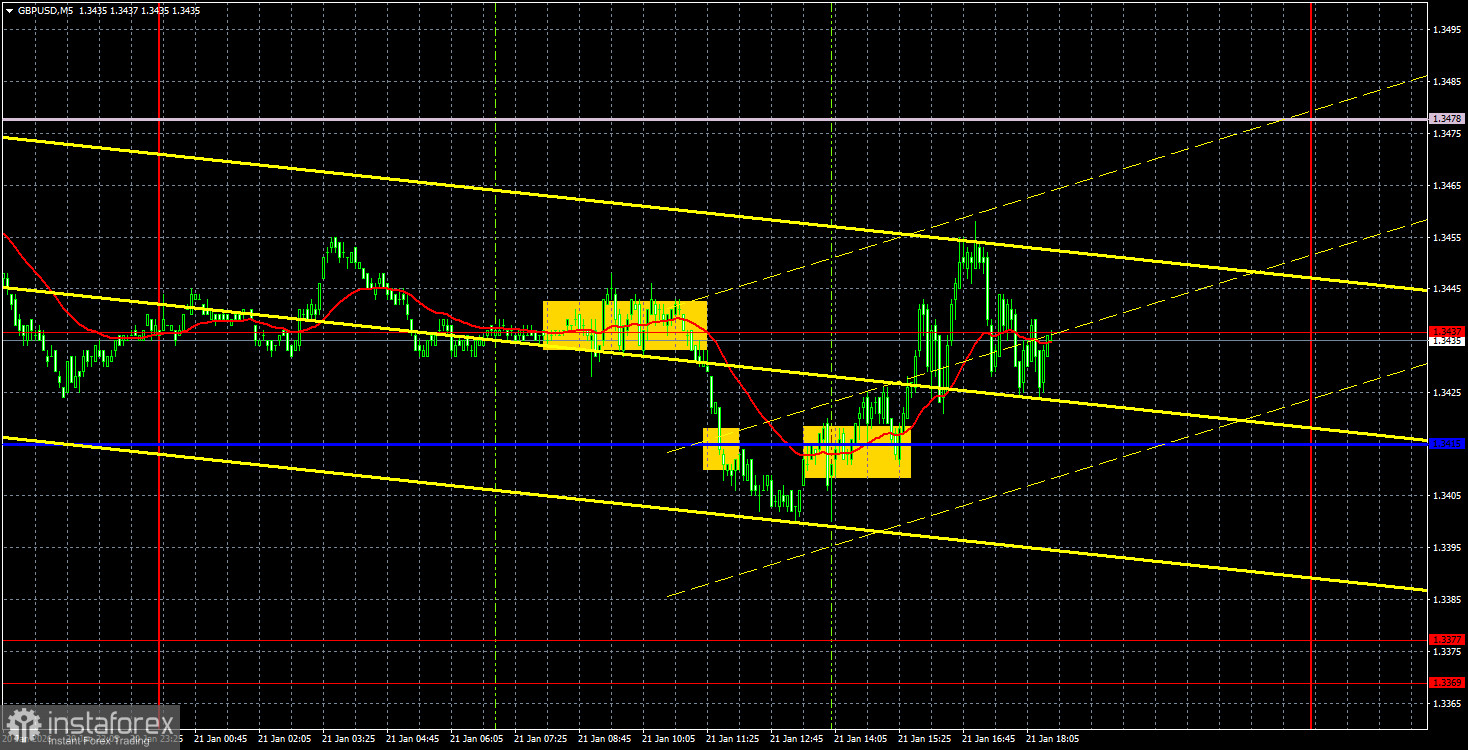
On the 5-minute TF, several trading signals were formed during the day, but most of them were random. Movements were absolutely random, and the market was very agitated due to the Davos forum, where the tension around Greenland was expected to ease, but instead grew stronger. The uptrend remains, but the pound urgently needs to overcome the Senkou Span B line.
COT Report
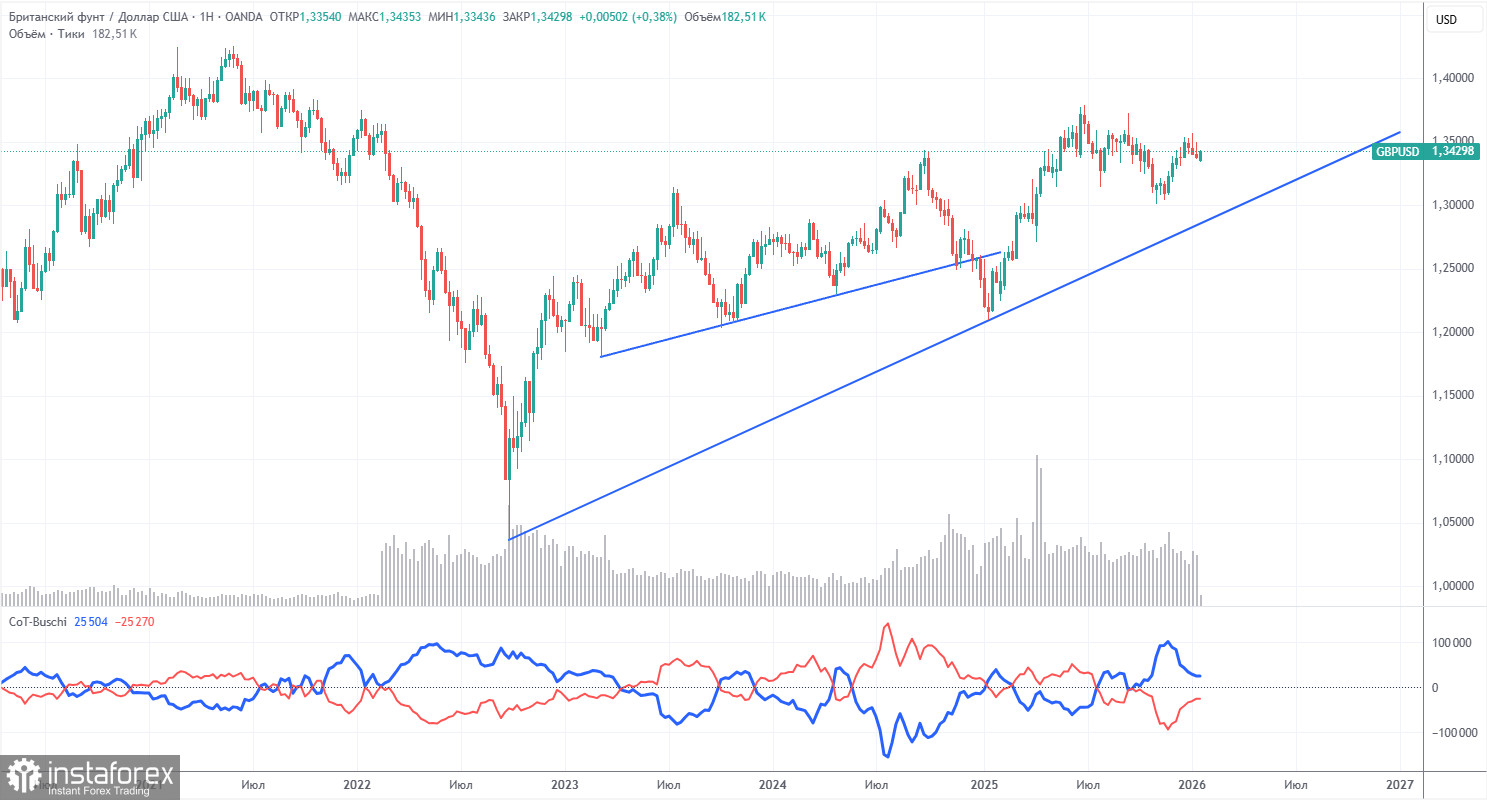
COT reports for the British pound show that, in recent years, commercial traders' sentiment has been changing frequently. The red and blue lines, reflecting net positions of commercial and non-commercial traders, constantly cross and are, in most cases, close to the zero level. At present, the lines are converging, with non-commercial traders dominating on the sell side. Lately, speculators have increased their long positions, so a mood change is possible soon, which would not significantly affect GBP/USD in isolation.
The dollar continues to decline due to Donald Trump's policies, as shown clearly in the weekly TF (illustration above). The trade war will continue in one form or another for a long time, and the Fed will, in any case, cut rates within the next 12 months. Demand for the dollar will fall one way or another. According to the latest COT report (dated January 13) for the pound, the Non-commercial group opened 2,500 BUY contracts and closed 2,700 SELL contracts. Thus, the net position of non-commercial traders increased by 5,200 contracts over the week.
In 2025, the pound rose quite strongly, but it should be understood that the reason is one: Donald Trump's policy. Once that factor is neutralized, the dollar could resume growth, but when that will happen is unknown.
Analysis GBP/USD 1H
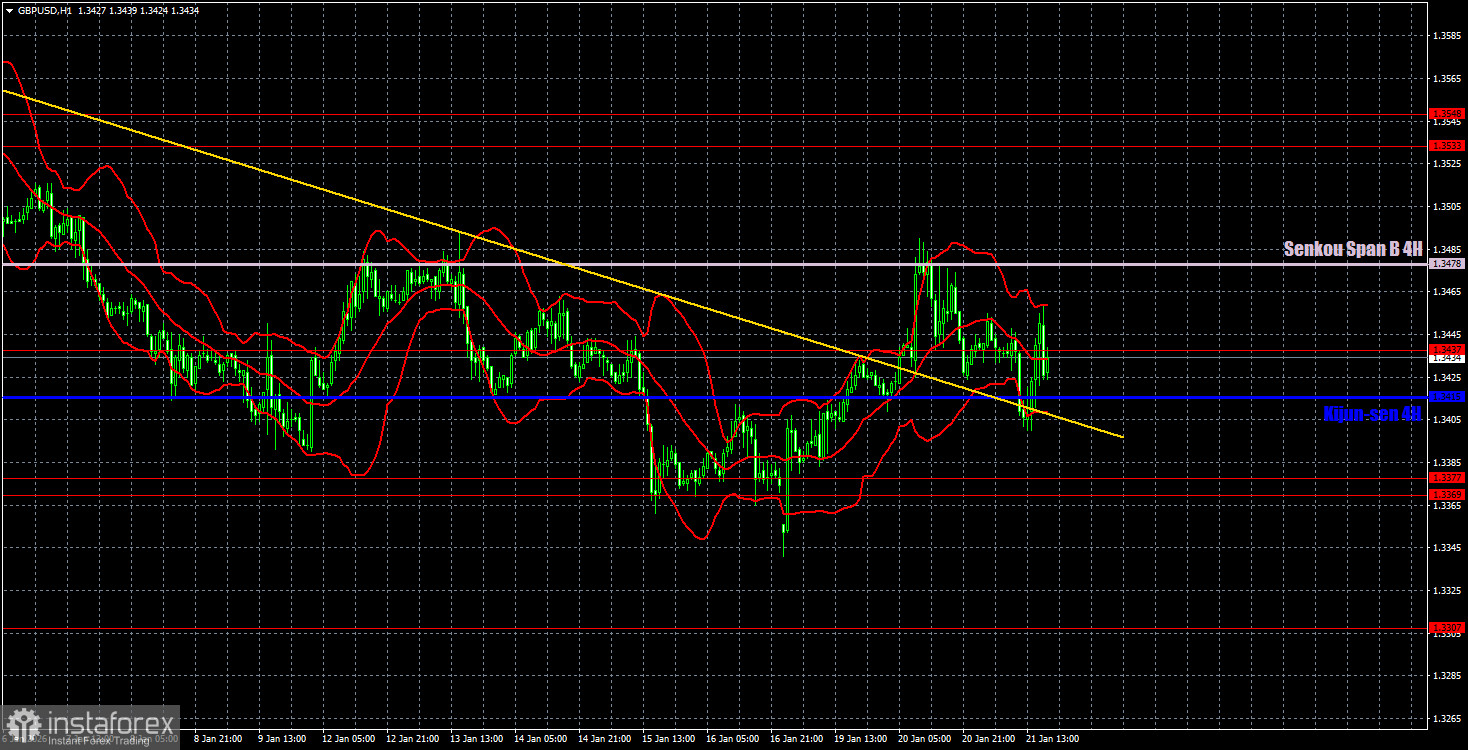
On the hourly timeframe, the GBP/USD pair has also formed an uptrend; it only remains to overcome the Senkou Span B line. If that happens, the pound sterling will head for last year's highs. The fundamental and macroeconomic backdrop fully supports this scenario, and the market spent a whole six months correcting and building strength for a new push north.
For January 22, we highlight the following important levels: 1.3042–1.3050, 1.3096–1.3115, 1.3201–1.3212, 1.3307, 1.3369–1.3377, 1.3437, 1.3533–1.3548, 1.3615, 1.3681, 1.3763. The Senkou Span B (1.3478) and Kijun-sen (1.3415) lines can also be sources of signals. It is recommended to move the stop loss to breakeven once the price has moved 20 pips in the correct direction. Ichimoku lines may shift during the day, which should be taken into account when determining trading signals.
No significant events are scheduled in the UK on Thursday, while the US will publish the third GDP estimate for Q3 and several reports that are of little interest. However, new information about the Davos forum may emerge throughout the day, and we would not be surprised if many new scandals and loud statements surface. The market may remain excited and trade on emotions until the end of the week.
Trading recommendations:
Today, traders may consider new short positions with a target of 1.3437 if there is a rebound from the Senkou Span B line. Long positions become relevant if the price breaks above the Senkou Span B line, with a target in the 1.3533–1.3548 area.
Explanations of the illustrations:
- Price support and resistance levels (resistance/support) — thick red lines near which movement may end. They are not sources of trading signals.
- Kijun-sen and Senkou Span B lines — Ichimoku indicator lines transferred to the hourly timeframe from the 4-hour. They are strong lines.
- Extremum levels — thin red lines from which the price previously bounced. They are sources of trading signals.
- Yellow lines — trend lines, trend channels, and any other technical patterns.
- Indicator 1 on the COT charts — the size of the net position of each trader category.