 English
  Русский
 Bahasa Indonesia
 Bahasa Malay
 ไทย
ไทย Español
 Deutsch
 Български
 Français
 Tiếng Việt
 中文
中文 বাংলা
বাংলা हिन्दी
 Čeština
 Українська
 Română

GBP/USD 5M Analysis
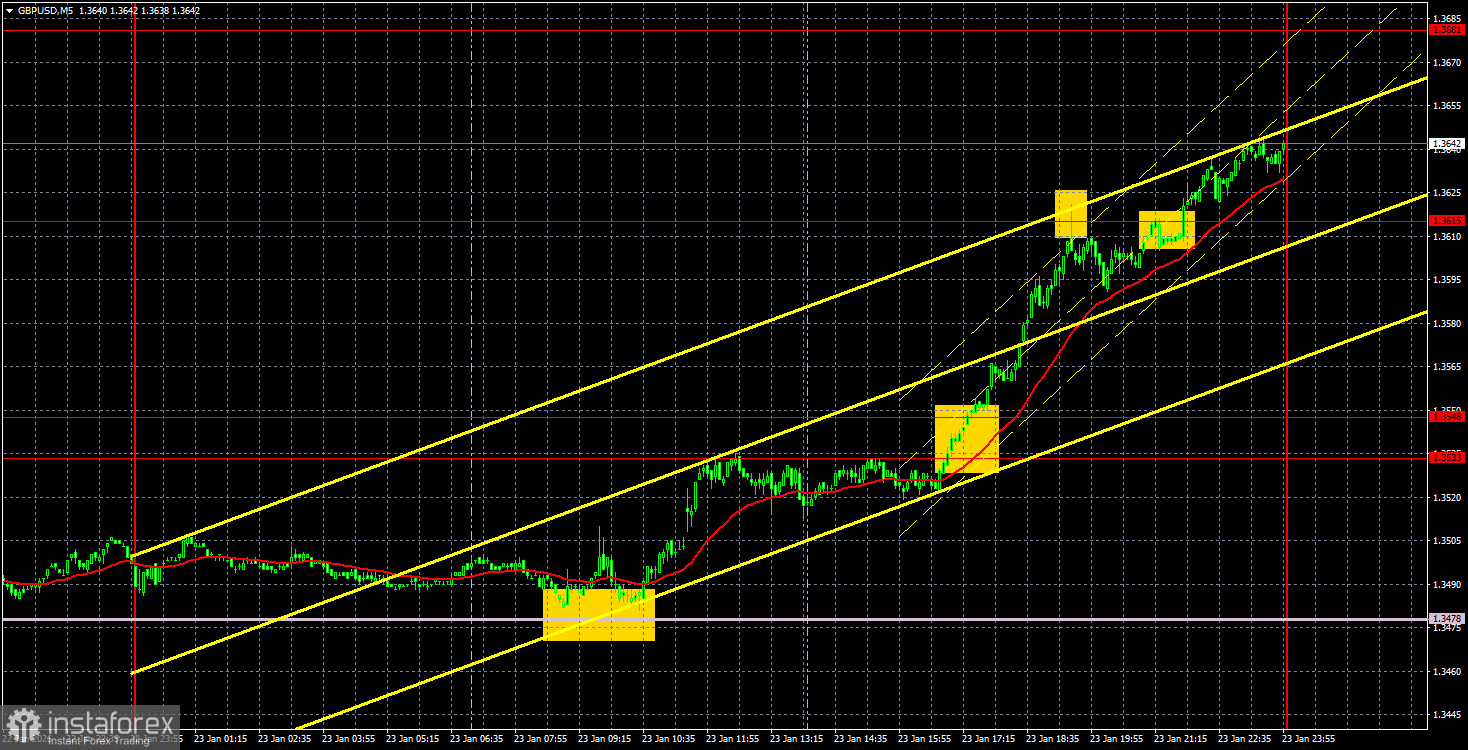
The GBP/USD currency pair also traded with substantial gains on Friday, with the pound increasing by 150 pips throughout the day. Such a strong rise should have been provoked by something or someone, right? Yes and no. There were quite a few macroeconomic reports on Friday in both the UK and the US. However, none of them were directly related to the pair's rise of one and a half cents. The British business activity indices were noted as they genuinely supported the British pound during the European session. Both indices exceeded forecasts, prompting the pound to rise by 30-40 pips. However, the main movement began almost in the evening, and the American macroeconomic background had no influence on it.
So, why did the dollar sharply weaken on Friday? Because it had been declining throughout the week. The dollar's decline over the week was due to Donald Trump's policies: he initially imposed new tariffs on European countries (particularly the UK), then canceled them, sparked panic over the island of Greenland, and then renounced his imperial ambitions. All these events further decreased the willingness of traders and investors to deal with a currency whose president changes his mind five times a week and threatens to forcibly seize sovereign territory from the EU.
On the 5-minute timeframe on Friday, several trading signals were formed. The first was generated in the morning, and this was the only trade that traders could open. The price bounced twice off the Senkou Span B line, after which a prolonged upward movement began. By the end of the day, the pair reached 1.3615, where it was possible to take profits.
COT Report
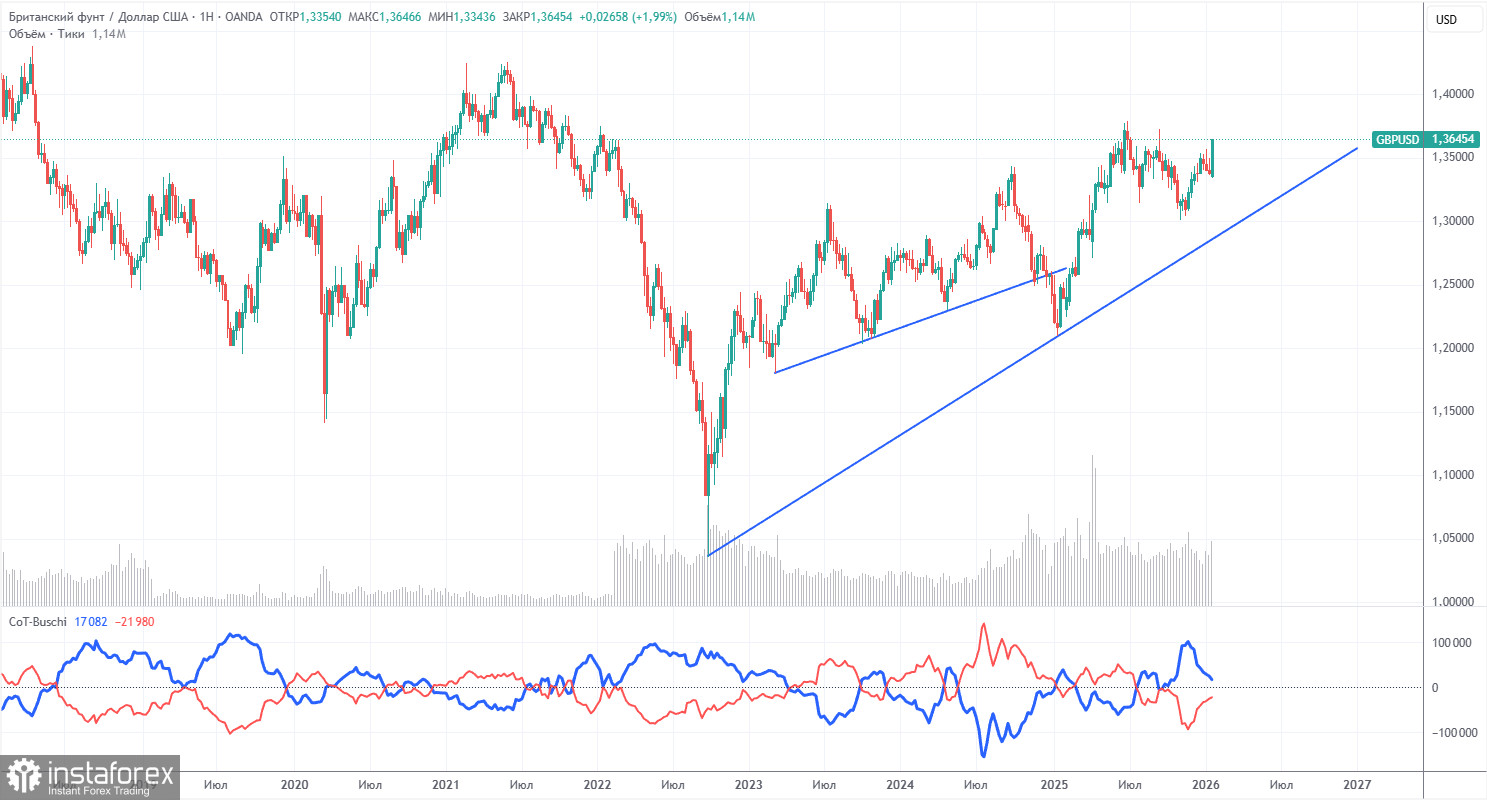
The COT reports for the British pound show that, in recent years, sentiment among commercial traders has fluctuated. The red and blue lines, representing the net positions of commercial and non-commercial traders, frequently cross each other and are usually close to the zero mark. Currently, the lines are approaching one another, with non-commercial traders dominating with... shorts. Recently, speculators have begun increasing long positions, suggesting a shift in sentiment is likely soon, which is unlikely to significantly impact the GBP/USD pair.
The dollar continues to decline due to Donald Trump's policies, as shown on the weekly timeframe (illustration above). The trade war will persist in one form or another for a long time, and the Fed will, in any case, lower rates in the next 12 months. Demand for the dollar will decline one way or another. According to the latest COT report (dated January 20) for the British pound, the "Non-commercial" group opened 2,300 BUY contracts and closed 900 SELL contracts. Thus, the net position of non-commercial traders increased by 3,200 contracts over the week.
In 2025, the pound rose quite significantly, but it should be understood that there is one reason: Donald Trump's policy. Once this reason is neutralized, the dollar may start to rise, but when this will happen is anyone's guess.
GBP/USD 1H Analysis
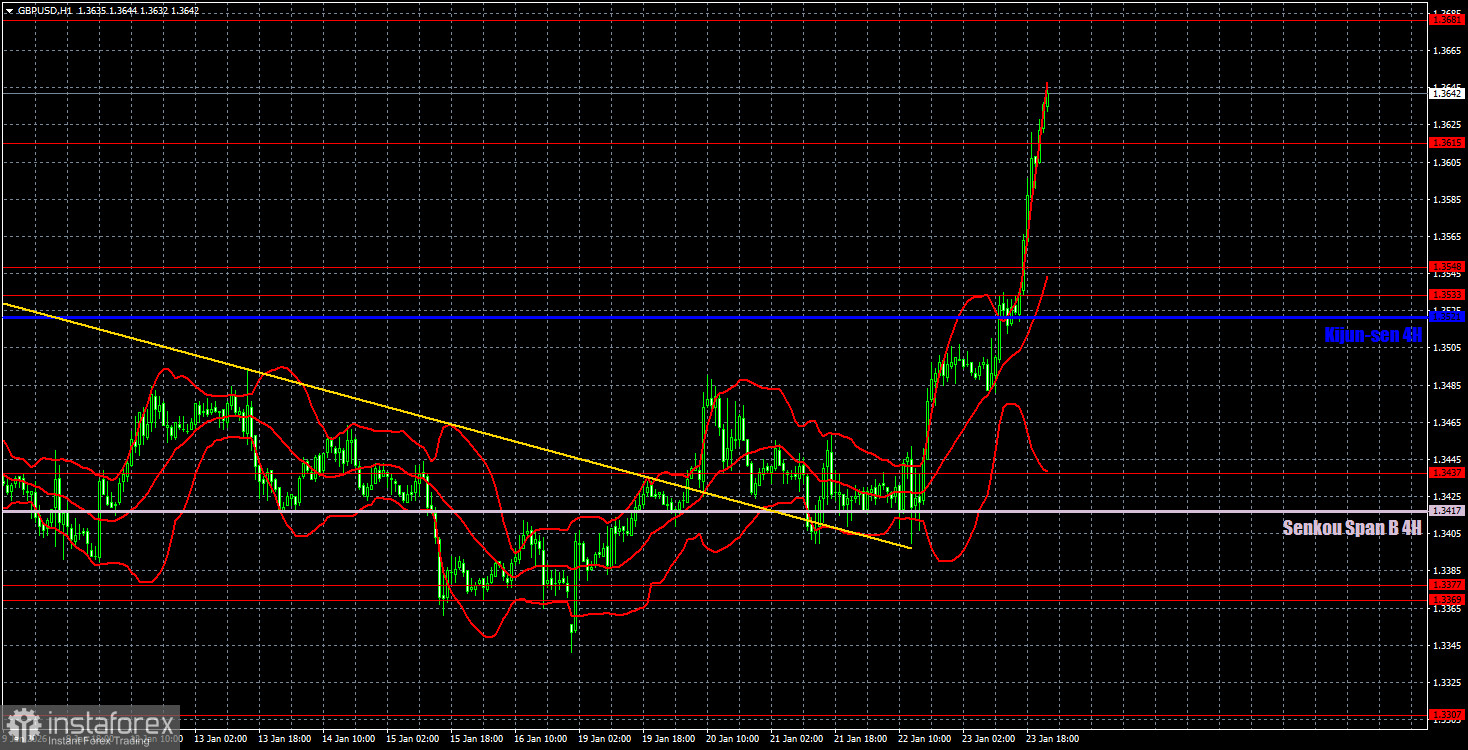
On the hourly timeframe, the GBP/USD pair continues to form an upward trend. Thus, we believe that the British pound is targeting last year's highs. The fundamental and macroeconomic backdrop fully supports this scenario, as the market has been correcting for six months and gathering strength for a new upward push.
For January 26, we highlight the following important levels: 1.3042-1.3050, 1.3096-1.3115, 1.3201-1.3212, 1.3307, 1.3369-1.3377, 1.3437, 1.3533-1.3548, 1.3615, 1.3681, 1.3763. The Senkou Span B line (1.3417) and Kijun-sen (1.3521) may also serve as sources of signals. It is recommended to set the Stop Loss level to break-even if the price moves in the correct direction by 20 pips. The Ichimoku indicator lines may move throughout the day, which should be taken into account when determining trading signals.
On Monday, there are no important events or reports scheduled in the UK, while the U.S. will release a relatively important report on durable goods orders, which may reflect in the charts.
Trading Recommendations:
Today, traders can consider short positions with a target at 1.3548 if the price consolidates below 1.3615. Long positions remain relevant with targets at 1.3681 and 1.3763, as the level of 1.3615 was broken on Friday.
Explanations for the Illustrations:
- Price support and resistance levels (resistance/support) — thick red lines near which movement may end. They are not sources of trading signals.
- Kijun-sen and Senkou Span B lines — Ichimoku indicator lines transferred to the hourly timeframe from the 4-hour. They are strong lines.
- Extremum levels — thin red lines from which the price previously bounced. They are sources of trading signals.
- Yellow lines — trend lines, trend channels, and any other technical patterns.
- Indicator 1 on the COT charts — the size of the net position of each trader category.